DCQA: Document-Level Chart Question Answering towards Complex Reasoning and Common-Sense Understanding
Paper and Code
Oct 29, 2023


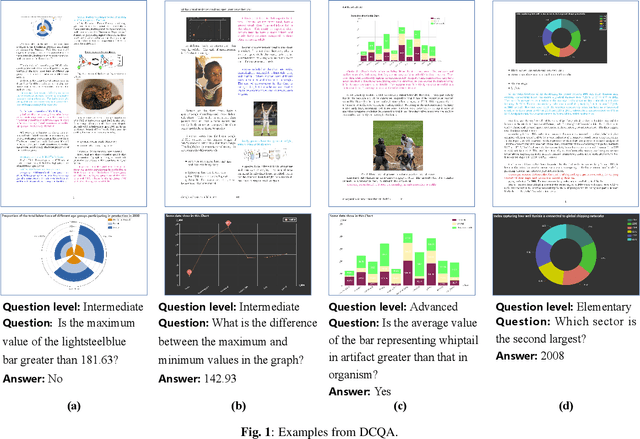
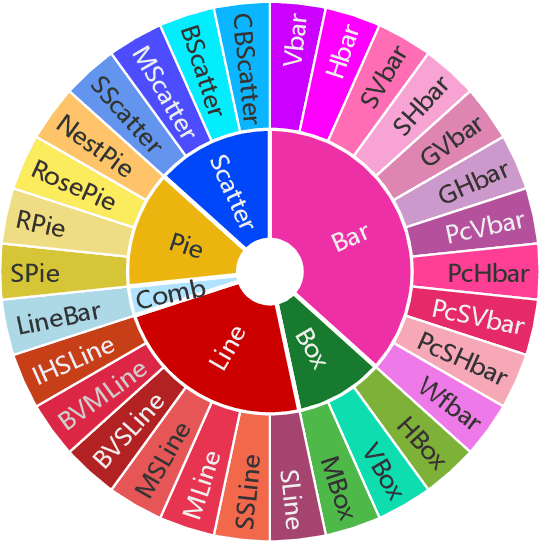
Visually-situated languages such as charts and plots are omnipresent in real-world documents. These graphical depictions are human-readable and are often analyzed in visually-rich documents to address a variety of questions that necessitate complex reasoning and common-sense responses. Despite the growing number of datasets that aim to answer questions over charts, most only address this task in isolation, without considering the broader context of document-level question answering. Moreover, such datasets lack adequate common-sense reasoning information in their questions. In this work, we introduce a novel task named document-level chart question answering (DCQA). The goal of this task is to conduct document-level question answering, extracting charts or plots in the document via document layout analysis (DLA) first and subsequently performing chart question answering (CQA). The newly developed benchmark dataset comprises 50,010 synthetic documents integrating charts in a wide range of styles (6 styles in contrast to 3 for PlotQA and ChartQA) and includes 699,051 questions that demand a high degree of reasoning ability and common-sense understanding. Besides, we present the development of a potent question-answer generation engine that employs table data, a rich color set, and basic question templates to produce a vast array of reasoning question-answer pairs automatically. Based on DCQA, we devise an OCR-free transformer for document-level chart-oriented understanding, capable of DLA and answering complex reasoning and common-sense questions over charts in an OCR-free manner. Our DCQA dataset is expected to foster research on understanding visualizations in documents, especially for scenarios that require complex reasoning for charts in the visually-rich document. We implement and evaluate a set of baselines, and our proposed method achieves comparable results.
 Add to Chrome
 Add to Firefox
 Add to Edge