Zoe Haskell-Craig
Understanding Disparities in Post Hoc Machine Learning Explanation
Jan 25, 2024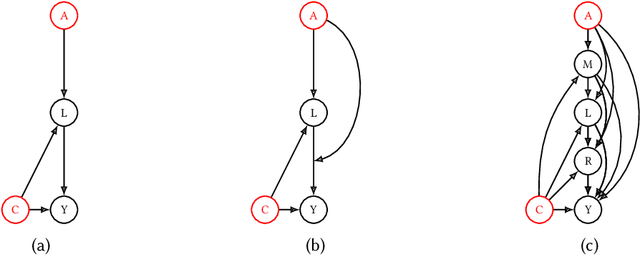
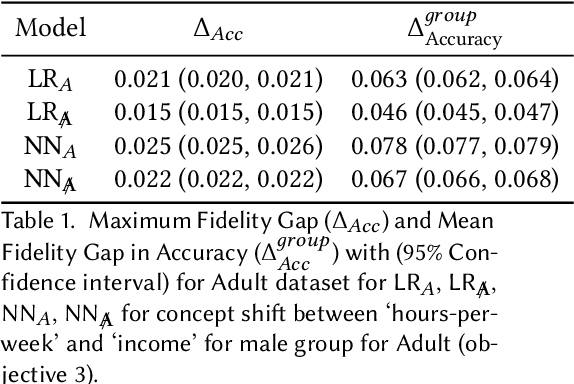
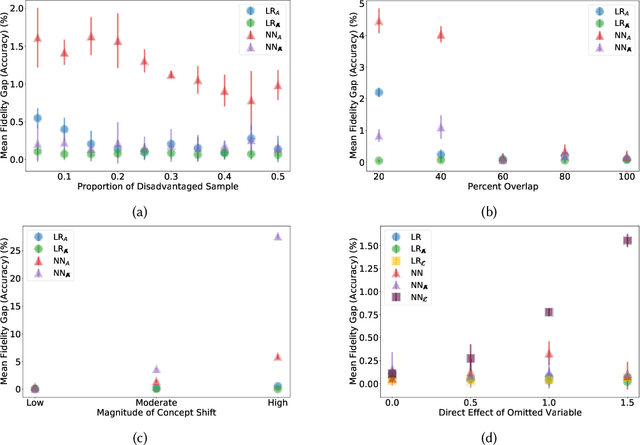
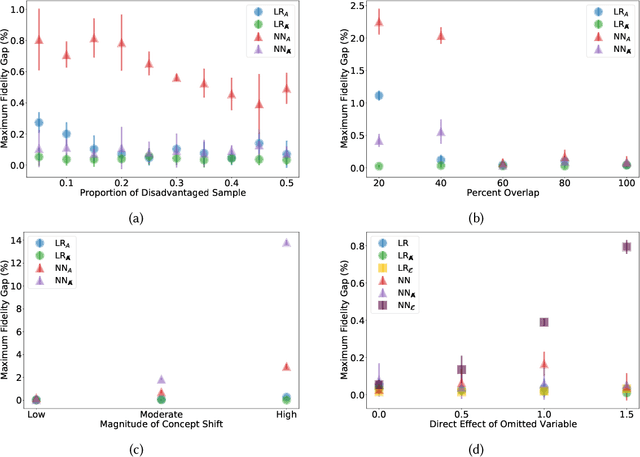
Abstract:Previous work has highlighted that existing post-hoc explanation methods exhibit disparities in explanation fidelity (across 'race' and 'gender' as sensitive attributes), and while a large body of work focuses on mitigating these issues at the explanation metric level, the role of the data generating process and black box model in relation to explanation disparities remains largely unexplored. Accordingly, through both simulations as well as experiments on a real-world dataset, we specifically assess challenges to explanation disparities that originate from properties of the data: limited sample size, covariate shift, concept shift, omitted variable bias, and challenges based on model properties: inclusion of the sensitive attribute and appropriate functional form. Through controlled simulation analyses, our study demonstrates that increased covariate shift, concept shift, and omission of covariates increase explanation disparities, with the effect pronounced higher for neural network models that are better able to capture the underlying functional form in comparison to linear models. We also observe consistent findings regarding the effect of concept shift and omitted variable bias on explanation disparities in the Adult income dataset. Overall, results indicate that disparities in model explanations can also depend on data and model properties. Based on this systematic investigation, we provide recommendations for the design of explanation methods that mitigate undesirable disparities.
Understanding human mobility patterns in Chicago: an analysis of taxi data using clustering techniques
Jun 21, 2023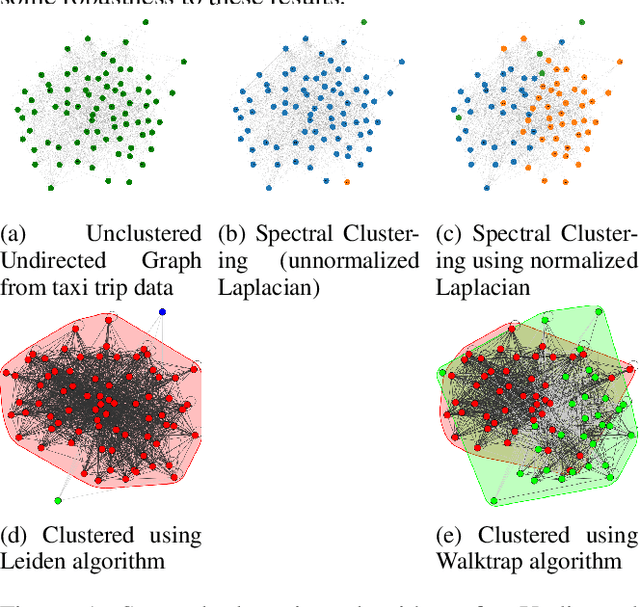
Abstract:Understanding human mobility patterns is important in applications as diverse as urban planning, public health, and political organizing. One rich source of data on human mobility is taxi ride data. Using the city of Chicago as a case study, we examine data from taxi rides in 2016 with the goal of understanding how neighborhoods are interconnected. This analysis will provide a sense of which neighborhoods individuals are using taxis to travel between, suggesting regions to focus new public transit development efforts. Additionally, this analysis will map traffic circulation patterns and provide an understanding of where in the city people are traveling from and where they are heading to - perhaps informing traffic or road pollution mitigation efforts. For the first application, representing the data as an undirected graph will suffice. Transit lines run in both directions so simply a knowledge of which neighborhoods have high rates of taxi travel between them provides an argument for placing public transit along those routes. However, in order to understand the flow of people throughout a city, we must make a distinction between the neighborhood from which people are departing and the areas to which they are arriving - this requires methods that can deal with directed graphs. All developed codes can be found at https://github.com/Nikunj-Gupta/Spectral-Clustering-Directed-Graphs.
Predicting blood pressure under circumstances of missing data: An analysis of missing data patterns and imputation methods using NHANES
May 01, 2023Abstract:The World Health Organization defines cardio-vascular disease (CVD) as "a group of disorders of the heart and blood vessels," including coronary heart disease and stroke (WHO 21). CVD is affected by "intermediate risk factors" such as raised blood pressure, raised blood glucose, raised blood lipids, and obesity. These are predominantly influenced by lifestyle and behaviour, including physical inactivity, unhealthy diets, high intake of salt, and tobacco and alcohol use. However, genetics and social/environmental factors such as poverty, stress, and racism also play an important role. Researchers studying the behavioural and environmental factors associated with these "intermediate risk factors" need access to high quality and detailed information on diet and physical activity. However, missing data are a pervasive problem in clinical and public health research, affecting both randomized trials and observational studies. Reasons for missing data can vary substantially across studies because of loss to follow-up, missed study visits, refusal to answer survey questions, or an unrecorded measurement during an office visit. One method of handling missing values is to simply delete observations for which there is missingness (called Complete Case Analysis). This is rarely used as deleting the data point containing missing data (List wise deletion) results in a smaller number of samples and thus affects accuracy. Additional methods of handling missing data exists, such as summarizing the variables with its observed values (Available Case Analysis). Motivated by the pervasiveness of missing data in the NHANES dataset, we will conduct an analysis of imputation methods under different simulated patterns of missing data. We will then apply these imputation methods to create a complete dataset upon which we can use ordinary least squares to predict blood pressure from diet and physical activity.
 Add to Chrome
 Add to Firefox
 Add to Edge