 Add to Chrome
 Add to Firefox
 Add to Edge
Counterfactual Explanations for Deep Two-Sample Testing
May 29, 2026Two-sample testing is a fundamental tool for detecting distributional differences across scientific domains, but classical tests (including kernel-based tests) can be ineffective on high-dimensional structured data such as images. Recent deep two-sample tests improve sensitivity in these settings by learning informative representations, yet they provide limited insight into which data features drive rejection of the null hypothesis $H_0$. To address this issue, we propose a counterfactual explanation framework for deep two-sample testing that generates sample-level edits moving observations from a source group toward a target group while explicitly reducing the discrepancy measured by the test. Our method combines a diffusion autoencoder with a pretrained deep two-sample test model and optimizes a maximum mean discrepancy (MMD) objective in the test model's representation space to produce plausible counterfactuals. We quantify distribution-level effects through changes in the test statistic and the resulting two-sample p-values. We evaluate the method on synthetic 2D shape datasets and two MRI cohorts. Across both settings, the counterfactual transformations consistently increase p-values relative to the original samples, indicating that the edited source set becomes statistically closer to the target distribution under the test. We measure minimality using LPIPS to ensure the counterfactuals remain close to the original samples. The resulting edits provide interpretable evidence of the features associated with the detected group differences. On MRI, the localized changes are consistent with known anatomical differences between cohorts.
Don't Get Me Wrong: How to apply Deep Visual Interpretations to Time Series
Mar 14, 2022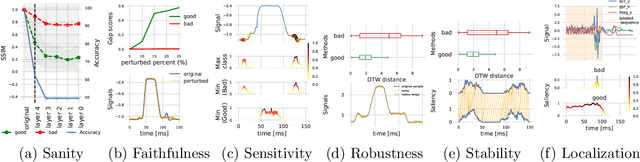
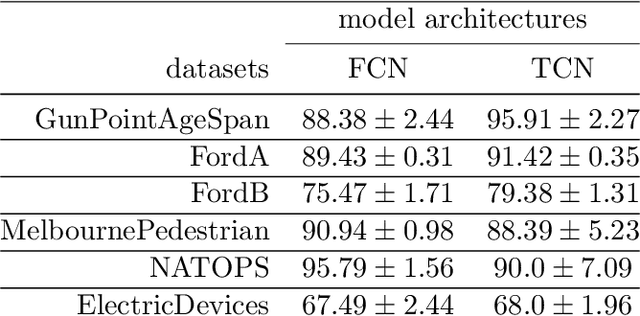
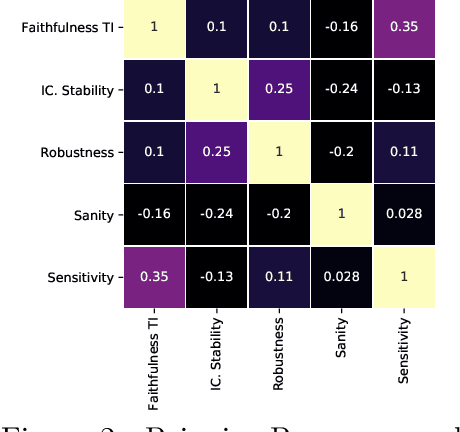
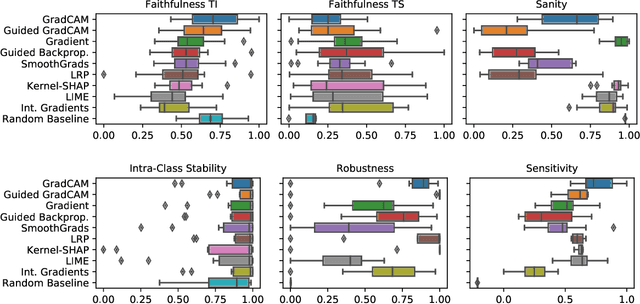
The correct interpretation and understanding of deep learning models is essential in many applications. Explanatory visual interpretation approaches for image and natural language processing allow domain experts to validate and understand almost any deep learning model. However, they fall short when generalizing to arbitrary time series data that is less intuitive and more diverse. Whether a visualization explains the true reasoning or captures the real features is difficult to judge. Hence, instead of blind trust we need an objective evaluation to obtain reliable quality metrics. We propose a framework of six orthogonal metrics for gradient- or perturbation-based post-hoc visual interpretation methods designed for time series classification and segmentation tasks. An experimental study includes popular neural network architectures for time series and nine visual interpretation methods. We evaluate the visual interpretation methods with diverse datasets from the UCR repository and a complex real-world dataset, and study the influence of common regularization techniques during training. We show that none of the methods consistently outperforms any of the others on all metrics while some are ahead at times. Our insights and recommendations allow experts to make informed choices of suitable visualization techniques for the model and task at hand.
Ubicomp Digital 2020 -- Handwriting classification using a convolutional recurrent network
Aug 03, 2020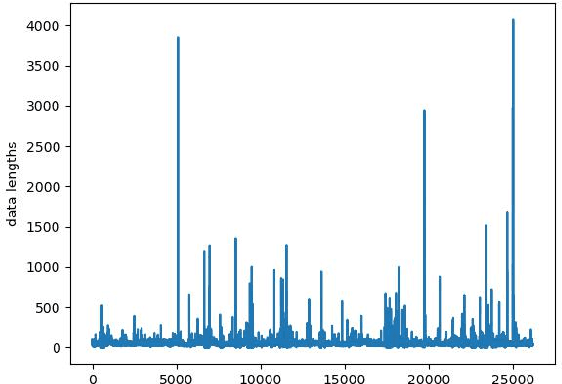
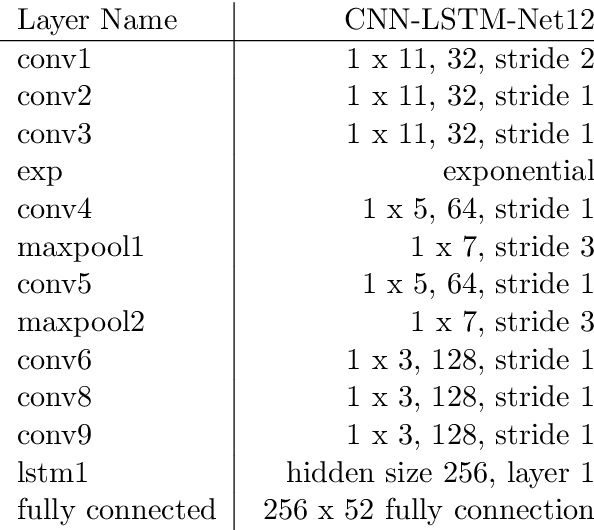
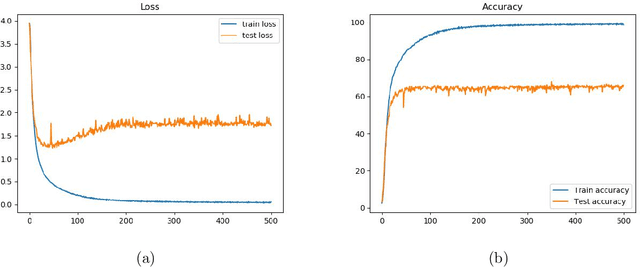
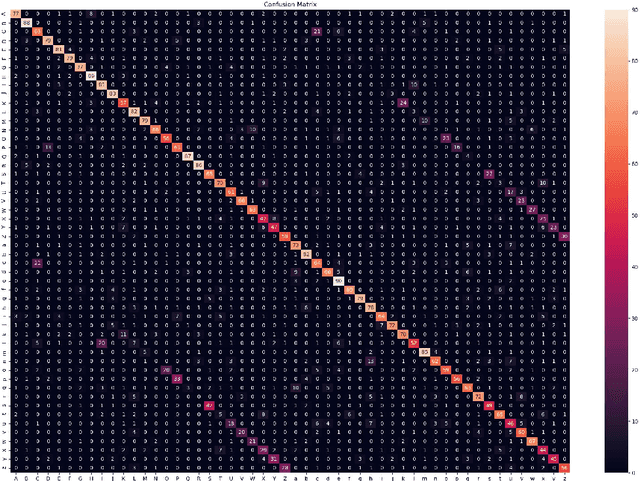
The Ubicomp Digital 2020 -- Time Series Classification Challenge from STABILO is a challenge about multi-variate time series classification. The data collected from 100 volunteer writers, and contains 15 features measured with multiple sensors on a pen. In this paper,we use a neural network to classify the data into 52 classes, that is lower and upper cases of Arabic letters. The proposed architecture of the neural network a is CNN-LSTM network. It combines convolutional neural network (CNN) for short term context with along short term memory layer (LSTM) for also long term dependencies. We reached an accuracy of 68% on our writer exclusive test set and64.6% on the blind challenge test set resulting in the second place.