Lukas Schmidt
Don't Get Me Wrong: How to apply Deep Visual Interpretations to Time Series
Mar 14, 2022


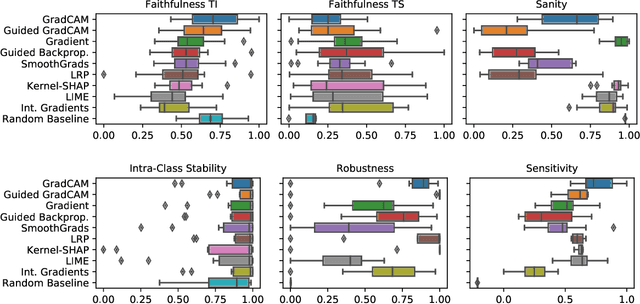
Abstract:The correct interpretation and understanding of deep learning models is essential in many applications. Explanatory visual interpretation approaches for image and natural language processing allow domain experts to validate and understand almost any deep learning model. However, they fall short when generalizing to arbitrary time series data that is less intuitive and more diverse. Whether a visualization explains the true reasoning or captures the real features is difficult to judge. Hence, instead of blind trust we need an objective evaluation to obtain reliable quality metrics. We propose a framework of six orthogonal metrics for gradient- or perturbation-based post-hoc visual interpretation methods designed for time series classification and segmentation tasks. An experimental study includes popular neural network architectures for time series and nine visual interpretation methods. We evaluate the visual interpretation methods with diverse datasets from the UCR repository and a complex real-world dataset, and study the influence of common regularization techniques during training. We show that none of the methods consistently outperforms any of the others on all metrics while some are ahead at times. Our insights and recommendations allow experts to make informed choices of suitable visualization techniques for the model and task at hand.
 Add to Chrome
 Add to Firefox
 Add to Edge