Petko Valtchev
Refining Decision Boundaries In Anomaly Detection Using Similarity Search Within the Feature Space
Feb 02, 2026Abstract:Detecting rare and diverse anomalies in highly imbalanced datasets-such as Advanced Persistent Threats (APTs) in cybersecurity-remains a fundamental challenge for machine learning systems. Active learning offers a promising direction by strategically querying an oracle to minimize labeling effort, yet conventional approaches often fail to exploit the intrinsic geometric structure of the feature space for model refinement. In this paper, we introduce SDA2E, a Sparse Dual Adversarial Attention-based AutoEncoder designed to learn compact and discriminative latent representations from imbalanced, high-dimensional data. We further propose a similarity-guided active learning framework that integrates three novel strategies to refine decision boundaries efficiently: mormal-like expansion, which enriches the training set with points similar to labeled normals to improve reconstruction fidelity; anomaly-like prioritization, which boosts ranking accuracy by focusing on points resembling known anomalies; and a hybrid strategy that combines both for balanced model refinement and ranking. A key component of our framework is a new similarity measure, Normalized Matching 1s (SIM_NM1), tailored for sparse binary embeddings. We evaluate SDA2E extensively across 52 imbalanced datasets, including multiple DARPA Transparent Computing scenarios, and benchmark it against 15 state-of-the-art anomaly detection methods. Results demonstrate that SDA2E consistently achieves superior ranking performance (nDCG up to 1.0 in several cases) while reducing the required labeled data by up to 80% compared to passive training. Statistical tests confirm the significance of these improvements. Our work establishes a robust, efficient, and statistically validated framework for anomaly detection that is particularly suited to cybersecurity applications such as APT detection.
Hack Me If You Can: Aggregating AutoEncoders for Countering Persistent Access Threats Within Highly Imbalanced Data
Jun 27, 2024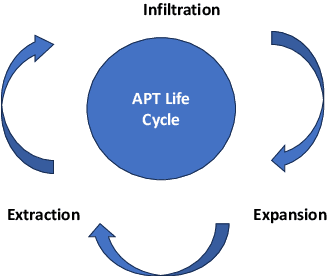
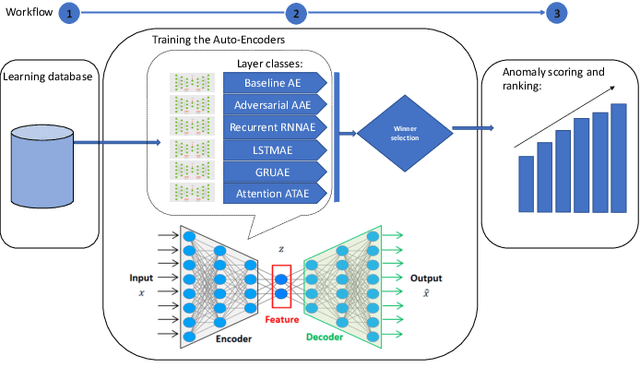
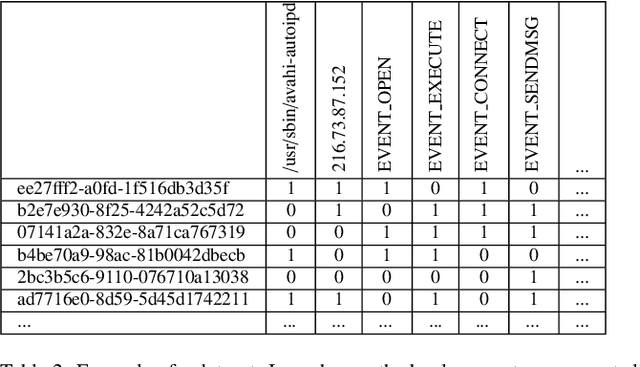
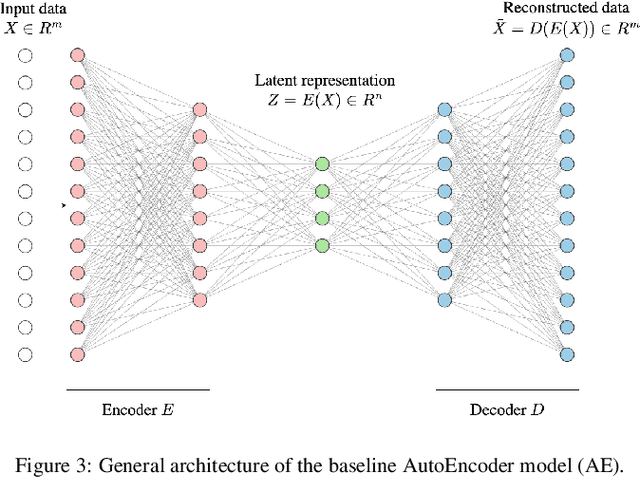
Abstract:Advanced Persistent Threats (APTs) are sophisticated, targeted cyberattacks designed to gain unauthorized access to systems and remain undetected for extended periods. To evade detection, APT cyberattacks deceive defense layers with breaches and exploits, thereby complicating exposure by traditional anomaly detection-based security methods. The challenge of detecting APTs with machine learning is compounded by the rarity of relevant datasets and the significant imbalance in the data, which makes the detection process highly burdensome. We present AE-APT, a deep learning-based tool for APT detection that features a family of AutoEncoder methods ranging from a basic one to a Transformer-based one. We evaluated our tool on a suite of provenance trace databases produced by the DARPA Transparent Computing program, where APT-like attacks constitute as little as 0.004% of the data. The datasets span multiple operating systems, including Android, Linux, BSD, and Windows, and cover two attack scenarios. The outcomes showed that AE-APT has significantly higher detection rates compared to its competitors, indicating superior performance in detecting and ranking anomalies.
A Rule Mining-Based Advanced Persistent Threats Detection System
May 20, 2021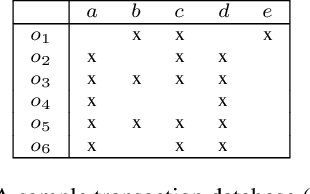
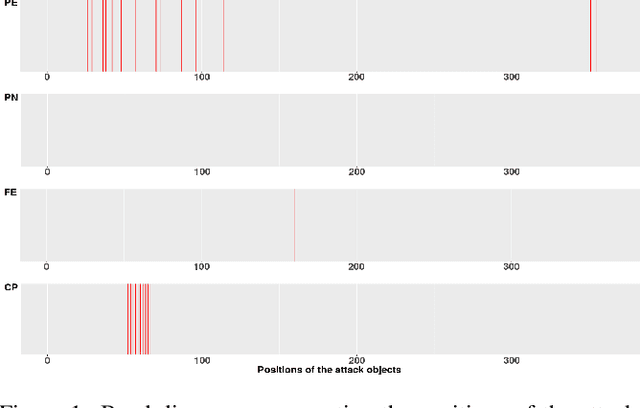


Abstract:Advanced persistent threats (APT) are stealthy cyber-attacks that are aimed at stealing valuable information from target organizations and tend to extend in time. Blocking all APTs is impossible, security experts caution, hence the importance of research on early detection and damage limitation. Whole-system provenance-tracking and provenance trace mining are considered promising as they can help find causal relationships between activities and flag suspicious event sequences as they occur. We introduce an unsupervised method that exploits OS-independent features reflecting process activity to detect realistic APT-like attacks from provenance traces. Anomalous processes are ranked using both frequent and rare event associations learned from traces. Results are then presented as implications which, since interpretable, help leverage causality in explaining the detected anomalies. When evaluated on Transparent Computing program datasets (DARPA), our method outperformed competing approaches.
CICLAD: A Fast and Memory-efficient Closed Itemset Miner for Streams
Jul 03, 2020


Abstract:Mining association rules from data streams is a challenging task due to the (typically) limited resources available vs. the large size of the result. Frequent closed itemsets (FCI) enable an efficient first step, yet current FCI stream miners are not optimal on resource consumption, e.g. they store a large number of extra itemsets at an additional cost. In a search for a better storage-efficiency trade-off, we designed Ciclad,an intersection-based sliding-window FCI miner. Leveraging in-depth insights into FCI evolution, it combines minimal storage with quick access. Experimental results indicate Ciclad's memory imprint is much lower and its performances globally better than competitor methods.
On the Reduction of Biases in Big Data Sets for the Detection of Irregular Power Usage
Apr 03, 2018


Abstract:In machine learning, a bias occurs whenever training sets are not representative for the test data, which results in unreliable models. The most common biases in data are arguably class imbalance and covariate shift. In this work, we aim to shed light on this topic in order to increase the overall attention to this issue in the field of machine learning. We propose a scalable novel framework for reducing multiple biases in high-dimensional data sets in order to train more reliable predictors. We apply our methodology to the detection of irregular power usage from real, noisy industrial data. In emerging markets, irregular power usage, and electricity theft in particular, may range up to 40% of the total electricity distributed. Biased data sets are of particular issue in this domain. We show that reducing these biases increases the accuracy of the trained predictors. Our models have the potential to generate significant economic value in a real world application, as they are being deployed in a commercial software for the detection of irregular power usage.
Impact of Biases in Big Data
Mar 02, 2018


Abstract:The underlying paradigm of big data-driven machine learning reflects the desire of deriving better conclusions from simply analyzing more data, without the necessity of looking at theory and models. Is having simply more data always helpful? In 1936, The Literary Digest collected 2.3M filled in questionnaires to predict the outcome of that year's US presidential election. The outcome of this big data prediction proved to be entirely wrong, whereas George Gallup only needed 3K handpicked people to make an accurate prediction. Generally, biases occur in machine learning whenever the distributions of training set and test set are different. In this work, we provide a review of different sorts of biases in (big) data sets in machine learning. We provide definitions and discussions of the most commonly appearing biases in machine learning: class imbalance and covariate shift. We also show how these biases can be quantified and corrected. This work is an introductory text for both researchers and practitioners to become more aware of this topic and thus to derive more reliable models for their learning problems.
Identifying Irregular Power Usage by Turning Predictions into Holographic Spatial Visualizations
Sep 09, 2017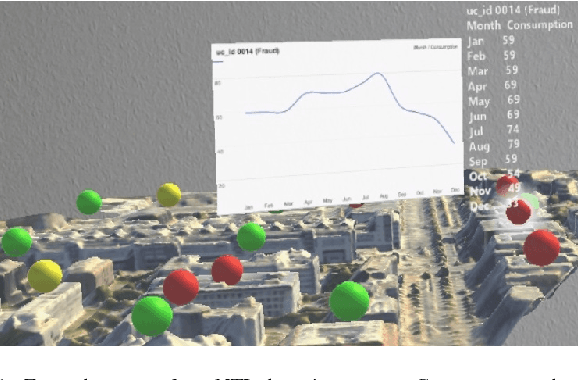
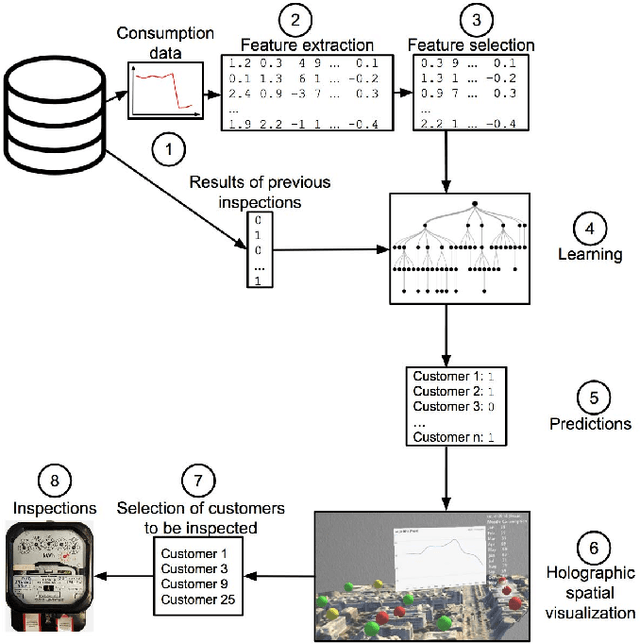


Abstract:Power grids are critical infrastructure assets that face non-technical losses (NTL) such as electricity theft or faulty meters. NTL may range up to 40% of the total electricity distributed in emerging countries. Industrial NTL detection systems are still largely based on expert knowledge when deciding whether to carry out costly on-site inspections of customers. Electricity providers are reluctant to move to large-scale deployments of automated systems that learn NTL profiles from data due to the latter's propensity to suggest a large number of unnecessary inspections. In this paper, we propose a novel system that combines automated statistical decision making with expert knowledge. First, we propose a machine learning framework that classifies customers into NTL or non-NTL using a variety of features derived from the customers' consumption data. The methodology used is specifically tailored to the level of noise in the data. Second, in order to allow human experts to feed their knowledge in the decision loop, we propose a method for visualizing prediction results at various granularity levels in a spatial hologram. Our approach allows domain experts to put the classification results into the context of the data and to incorporate their knowledge for making the final decisions of which customers to inspect. This work has resulted in appreciable results on a real-world data set of 3.6M customers. Our system is being deployed in a commercial NTL detection software.
Is Big Data Sufficient for a Reliable Detection of Non-Technical Losses?
Jul 25, 2017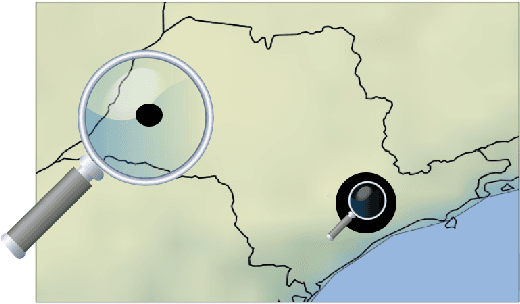
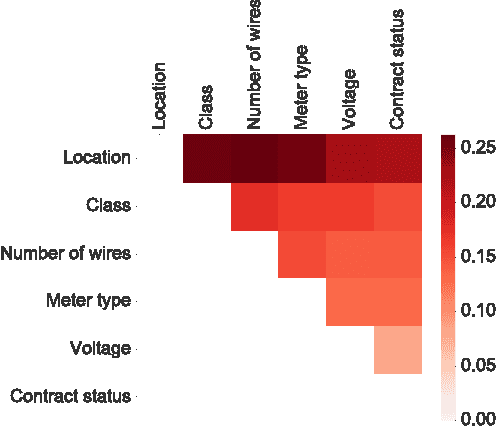
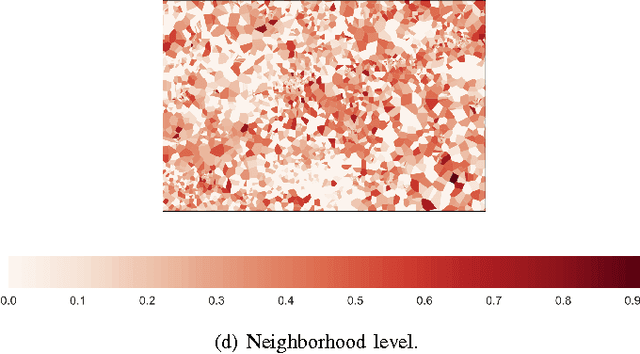
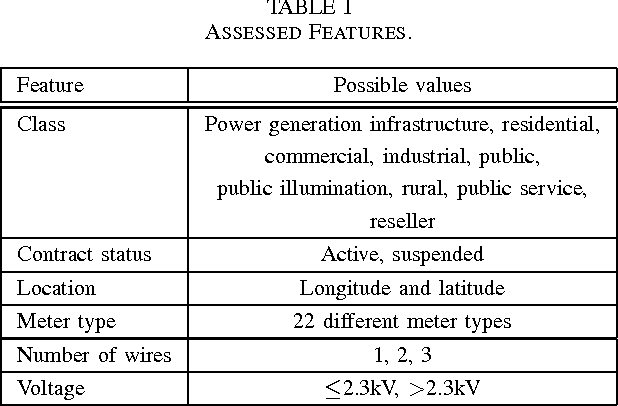
Abstract:Non-technical losses (NTL) occur during the distribution of electricity in power grids and include, but are not limited to, electricity theft and faulty meters. In emerging countries, they may range up to 40% of the total electricity distributed. In order to detect NTLs, machine learning methods are used that learn irregular consumption patterns from customer data and inspection results. The Big Data paradigm followed in modern machine learning reflects the desire of deriving better conclusions from simply analyzing more data, without the necessity of looking at theory and models. However, the sample of inspected customers may be biased, i.e. it does not represent the population of all customers. As a consequence, machine learning models trained on these inspection results are biased as well and therefore lead to unreliable predictions of whether customers cause NTL or not. In machine learning, this issue is called covariate shift and has not been addressed in the literature on NTL detection yet. In this work, we present a novel framework for quantifying and visualizing covariate shift. We apply it to a commercial data set from Brazil that consists of 3.6M customers and 820K inspection results. We show that some features have a stronger covariate shift than others, making predictions less reliable. In particular, previous inspections were focused on certain neighborhoods or customer classes and that they were not sufficiently spread among the population of customers. This framework is about to be deployed in a commercial product for NTL detection.
The Challenge of Non-Technical Loss Detection using Artificial Intelligence: A Survey
Jul 25, 2017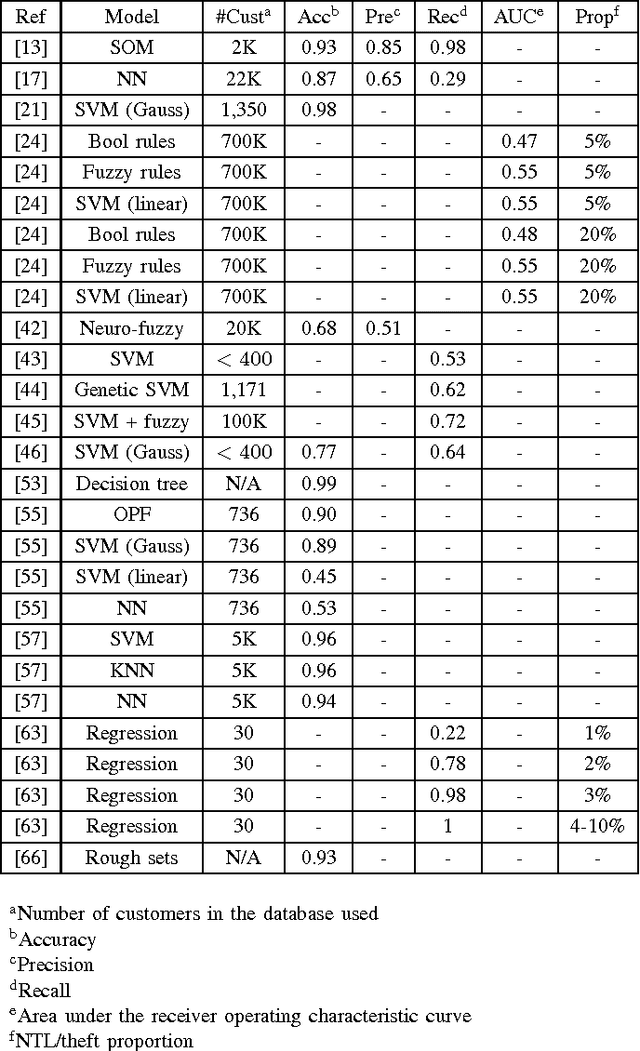
Abstract:Detection of non-technical losses (NTL) which include electricity theft, faulty meters or billing errors has attracted increasing attention from researchers in electrical engineering and computer science. NTLs cause significant harm to the economy, as in some countries they may range up to 40% of the total electricity distributed. The predominant research direction is employing artificial intelligence to predict whether a customer causes NTL. This paper first provides an overview of how NTLs are defined and their impact on economies, which include loss of revenue and profit of electricity providers and decrease of the stability and reliability of electrical power grids. It then surveys the state-of-the-art research efforts in a up-to-date and comprehensive review of algorithms, features and data sets used. It finally identifies the key scientific and engineering challenges in NTL detection and suggests how they could be addressed in the future.
The Top 10 Topics in Machine Learning Revisited: A Quantitative Meta-Study
Mar 29, 2017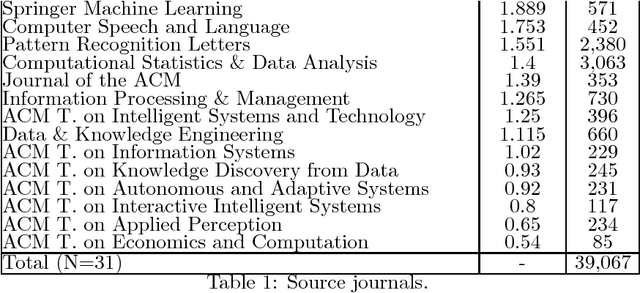
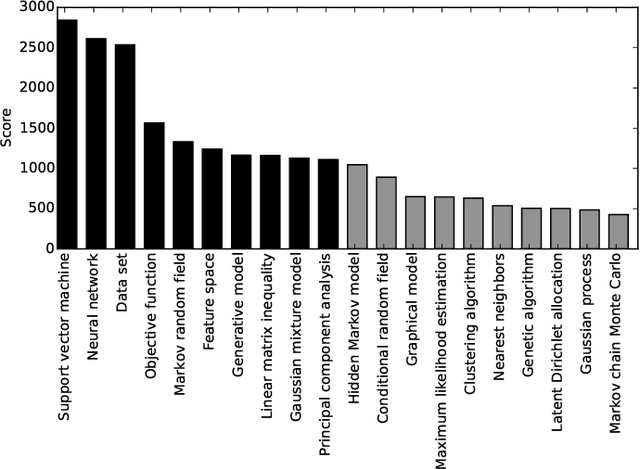
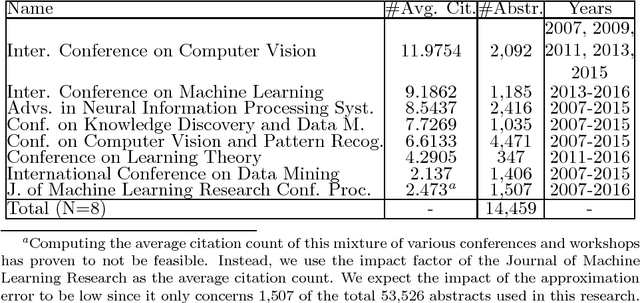
Abstract:Which topics of machine learning are most commonly addressed in research? This question was initially answered in 2007 by doing a qualitative survey among distinguished researchers. In our study, we revisit this question from a quantitative perspective. Concretely, we collect 54K abstracts of papers published between 2007 and 2016 in leading machine learning journals and conferences. We then use machine learning in order to determine the top 10 topics in machine learning. We not only include models, but provide a holistic view across optimization, data, features, etc. This quantitative approach allows reducing the bias of surveys. It reveals new and up-to-date insights into what the 10 most prolific topics in machine learning research are. This allows researchers to identify popular topics as well as new and rising topics for their research.
 Add to Chrome
 Add to Firefox
 Add to Edge