Angelo Migliosi
Is Big Data Sufficient for a Reliable Detection of Non-Technical Losses?
Jul 25, 2017


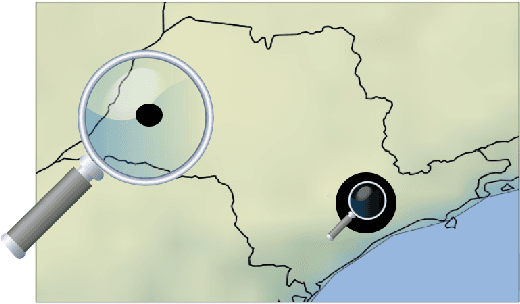
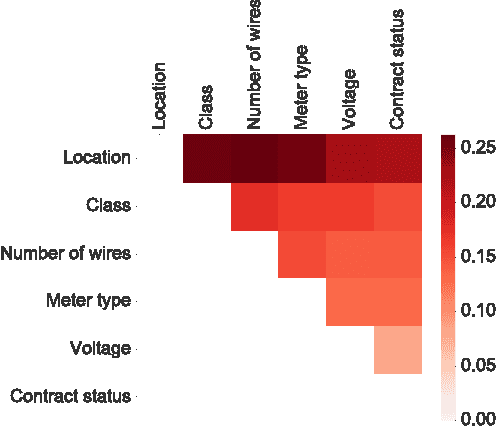
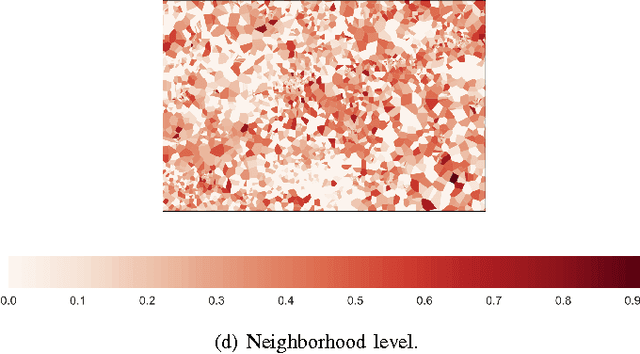
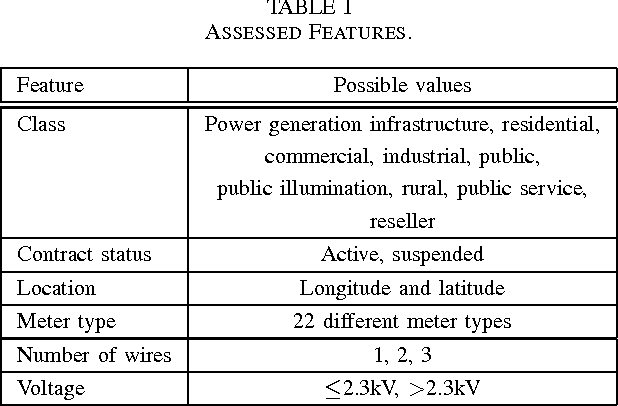
Abstract:Non-technical losses (NTL) occur during the distribution of electricity in power grids and include, but are not limited to, electricity theft and faulty meters. In emerging countries, they may range up to 40% of the total electricity distributed. In order to detect NTLs, machine learning methods are used that learn irregular consumption patterns from customer data and inspection results. The Big Data paradigm followed in modern machine learning reflects the desire of deriving better conclusions from simply analyzing more data, without the necessity of looking at theory and models. However, the sample of inspected customers may be biased, i.e. it does not represent the population of all customers. As a consequence, machine learning models trained on these inspection results are biased as well and therefore lead to unreliable predictions of whether customers cause NTL or not. In machine learning, this issue is called covariate shift and has not been addressed in the literature on NTL detection yet. In this work, we present a novel framework for quantifying and visualizing covariate shift. We apply it to a commercial data set from Brazil that consists of 3.6M customers and 820K inspection results. We show that some features have a stronger covariate shift than others, making predictions less reliable. In particular, previous inspections were focused on certain neighborhoods or customer classes and that they were not sufficiently spread among the population of customers. This framework is about to be deployed in a commercial product for NTL detection.
 Add to Chrome
 Add to Firefox
 Add to Edge