Paul Park
Development and validation of an artificial intelligence model to accurately predict spinopelvic parameters
Feb 09, 2024Abstract:Objective. Achieving appropriate spinopelvic alignment has been shown to be associated with improved clinical symptoms. However, measurement of spinopelvic radiographic parameters is time-intensive and interobserver reliability is a concern. Automated measurement tools have the promise of rapid and consistent measurements, but existing tools are still limited by some degree of manual user-entry requirements. This study presents a novel artificial intelligence (AI) tool called SpinePose that automatically predicts spinopelvic parameters with high accuracy without the need for manual entry. Methods. SpinePose was trained and validated on 761 sagittal whole-spine X-rays to predict sagittal vertical axis (SVA), pelvic tilt (PT), pelvic incidence (PI), sacral slope (SS), lumbar lordosis (LL), T1-pelvic angle (T1PA), and L1-pelvic angle (L1PA). A separate test set of 40 X-rays was labeled by 4 reviewers, including fellowship-trained spine surgeons and a fellowship-trained radiologist with neuroradiology subspecialty certification. Median errors relative to the most senior reviewer were calculated to determine model accuracy on test images. Intraclass correlation coefficients (ICC) were used to assess inter-rater reliability. Results. SpinePose exhibited the following median (interquartile range) parameter errors: SVA: 2.2(2.3)mm, p=0.93; PT: 1.3(1.2){\deg}, p=0.48; SS: 1.7(2.2){\deg}, p=0.64; PI: 2.2(2.1){\deg}, p=0.24; LL: 2.6(4.0){\deg}, p=0.89; T1PA: 1.1(0.9){\deg}, p=0.42; and L1PA: 1.4(1.6){\deg}, p=0.49. Model predictions also exhibited excellent reliability at all parameters (ICC: 0.91-1.0). Conclusions. SpinePose accurately predicted spinopelvic parameters with excellent reliability comparable to fellowship-trained spine surgeons and neuroradiologists. Utilization of predictive AI tools in spinal imaging can substantially aid in patient selection and surgical planning.
Discovering Exfiltration Paths Using Reinforcement Learning with Attack Graphs
Jan 28, 2022


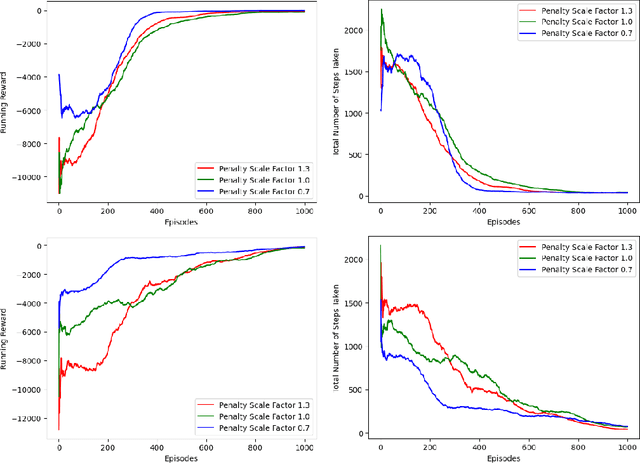
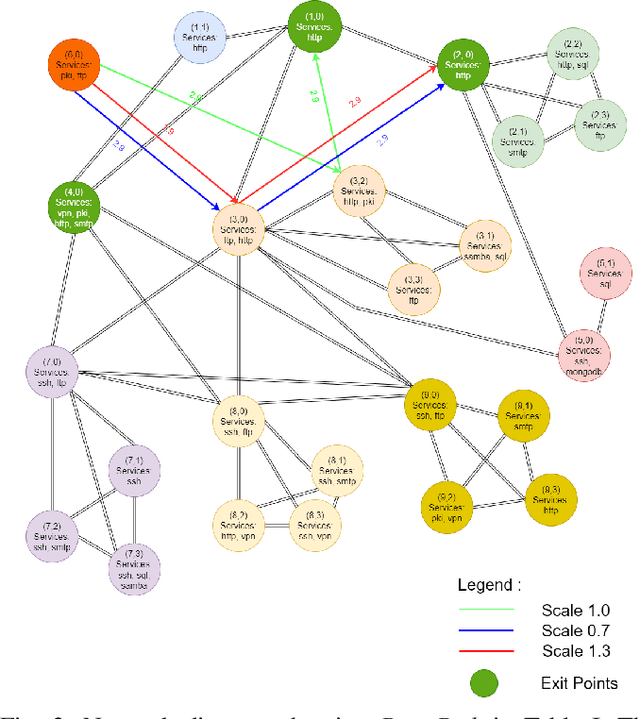
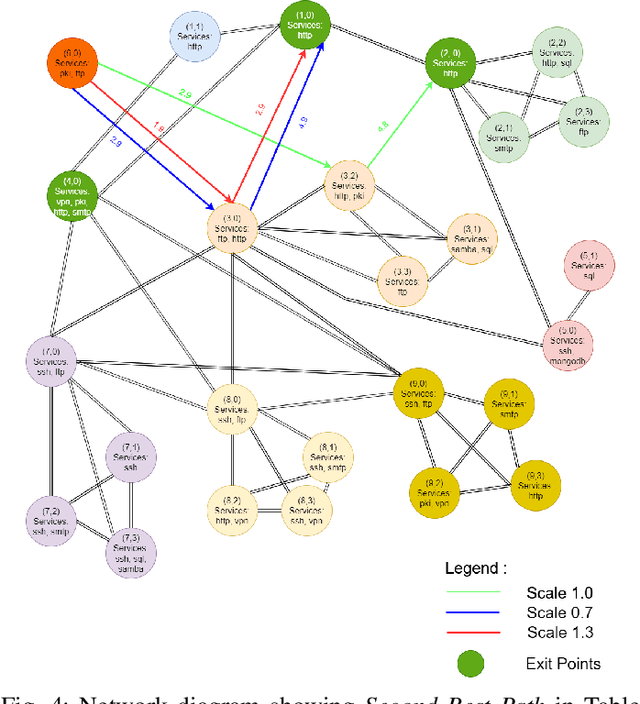
Abstract:Reinforcement learning (RL), in conjunction with attack graphs and cyber terrain, are used to develop reward and state associated with determination of optimal paths for exfiltration of data in enterprise networks. This work builds on previous crown jewels (CJ) identification that focused on the target goal of computing optimal paths that adversaries may traverse toward compromising CJs or hosts within their proximity. This work inverts the previous CJ approach based on the assumption that data has been stolen and now must be quietly exfiltrated from the network. RL is utilized to support the development of a reward function based on the identification of those paths where adversaries desire reduced detection. Results demonstrate promising performance for a sizable network environment.
Crown Jewels Analysis using Reinforcement Learning with Attack Graphs
Aug 20, 2021


Abstract:Cyber attacks pose existential threats to nations and enterprises. Current practice favors piece-wise analysis using threat-models in the stead of rigorous cyber terrain analysis and intelligence preparation of the battlefield. Automated penetration testing using reinforcement learning offers a new and promising approach for developing methodologies that are driven by network structure and cyber terrain, that can be later interpreted in terms of threat-models, but that are principally network-driven analyses. This paper presents a novel method for crown jewel analysis termed CJA-RL that uses reinforcement learning to identify key terrain and avenues of approach for exploiting crown jewels. In our experiment, CJA-RL identified ideal entry points, choke points, and pivots for exploiting a network with multiple crown jewels, exemplifying how CJA-RL and reinforcement learning for penetration testing generally can benefit computer network operations workflows.
Using Cyber Terrain in Reinforcement Learning for Penetration Testing
Aug 16, 2021


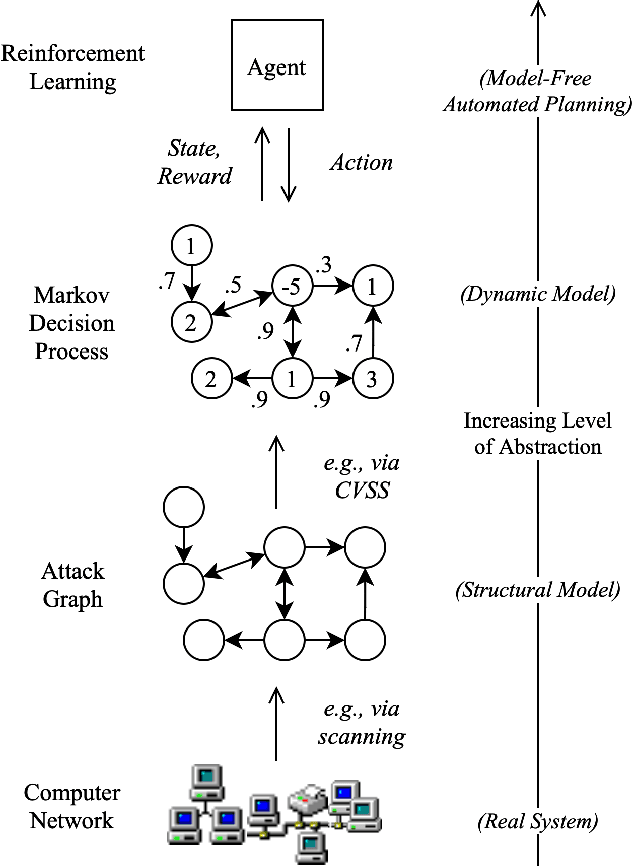
Abstract:Reinforcement learning (RL) has been applied to attack graphs for penetration testing, however, trained agents do not reflect reality because the attack graphs lack operational nuances typically captured within the intelligence preparation of the battlefield (IPB) that include notions of (cyber) terrain. In particular, current practice constructs attack graphs exclusively using the Common Vulnerability Scoring System (CVSS) and its components. We present methods for constructing attack graphs using notions from IPB on cyber terrain analysis of obstacles, avenues of approach, key terrain, observation and fields of fire, and cover and concealment. We demonstrate our methods on an example where firewalls are treated as obstacles and represented in (1) the reward space and (2) the state dynamics. We show that terrain analysis can be used to bring realism to attack graphs for RL.
 Add to Chrome
 Add to Firefox
 Add to Edge