Paolo Bajardi
Streamlining models with explanations in the learning loop
Feb 15, 2023Abstract:Several explainable AI methods allow a Machine Learning user to get insights on the classification process of a black-box model in the form of local linear explanations. With such information, the user can judge which features are locally relevant for the classification outcome, and get an understanding of how the model reasons. Standard supervised learning processes are purely driven by the original features and target labels, without any feedback loop informed by the local relevance of the features identified by the post-hoc explanations. In this paper, we exploit this newly obtained information to design a feature engineering phase, where we combine explanations with feature values. To do so, we develop two different strategies, named Iterative Dataset Weighting and Targeted Replacement Values, which generate streamlined models that better mimic the explanation process presented to the user. We show how these streamlined models compare to the original black-box classifiers, in terms of accuracy and compactness of the newly produced explanations.
* 16 pages, 10 figures, available repository
Multiscale Non-stationary Causal Structure Learning from Time Series Data
Aug 31, 2022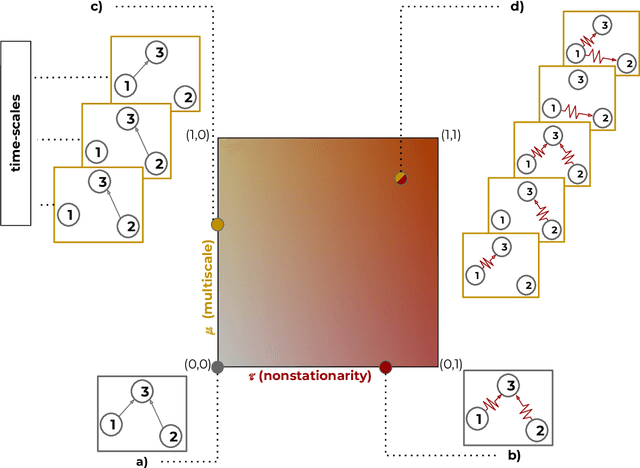
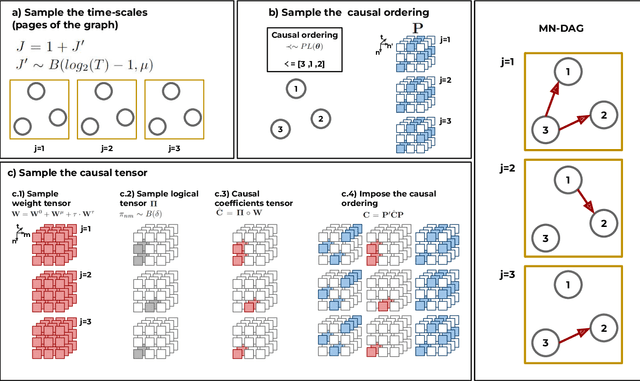
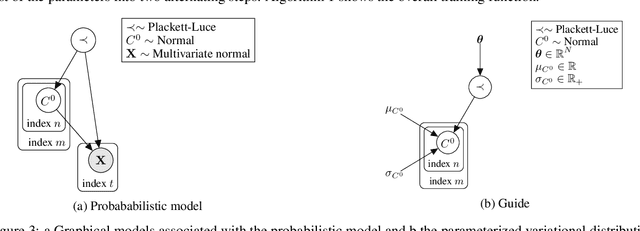
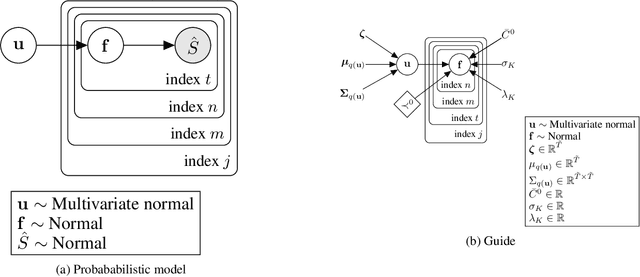
Abstract:This paper introduces a new type of causal structure, namely multiscale non-stationary directed acyclic graph (MN-DAG), that generalizes DAGs to the time-frequency domain. Our contribution is twofold. First, by leveraging results from spectral and causality theories, we expose a novel probabilistic generative model, which allows to sample an MN-DAG according to user-specified priors concerning the time-dependence and multiscale properties of the causal graph. Second, we devise a Bayesian method for the estimation of MN-DAGs, by means of stochastic variational inference (SVI), called Multiscale Non-Stationary Causal Structure Learner (MN-CASTLE). In addition to direct observations, MN-CASTLE exploits information from the decomposition of the total power spectrum of time series over different time resolutions. In our experiments, we first use the proposed model to generate synthetic data according to a latent MN-DAG, showing that the data generated reproduces well-known features of time series in different domains. Then we compare our learning method MN-CASTLE against baseline models on synthetic data generated with different multiscale and non-stationary settings, confirming the good performance of MN-CASTLE. Finally, we show some insights derived from the application of MN-CASTLE to study the causal structure of 7 global equity markets during the Covid-19 pandemic.
GRAPHSHAP: Motif-based Explanations for Black-box Graph Classifiers
Feb 17, 2022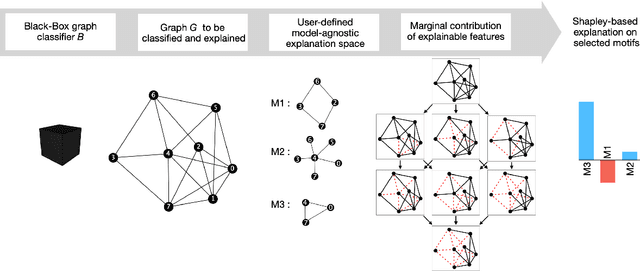
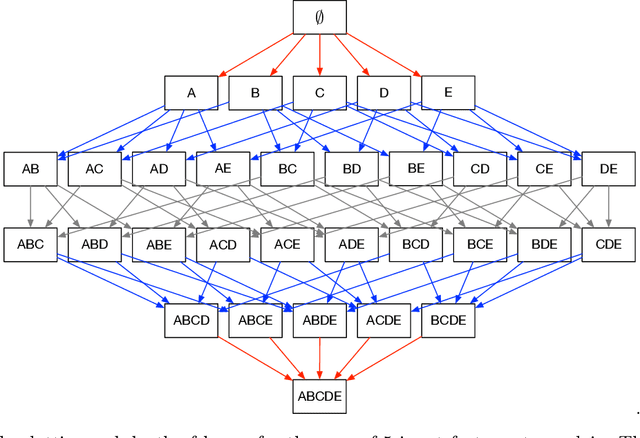
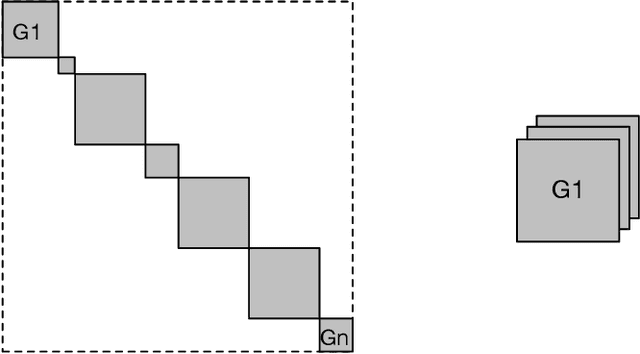
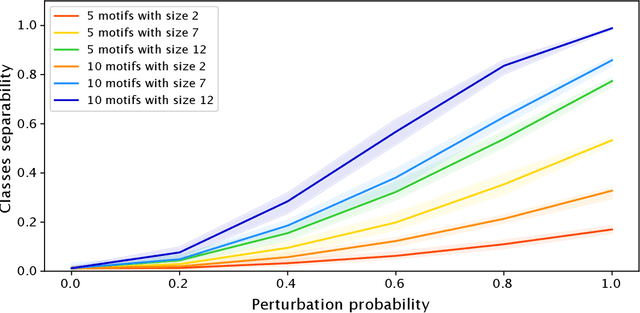
Abstract:Most methods for explaining black-box classifiers (e.g., on tabular data, images, or time series) rely on measuring the impact that the removal/perturbation of features has on the model output. This forces the explanation language to match the classifier features space. However, when dealing with graph data, in which the basic features correspond essentially to the adjacency information describing the graph structure (i.e., the edges), this matching between features space and explanation language might not be appropriate. In this regard, we argue that (i) a good explanation method for graph classification should be fully agnostic with respect to the internal representation used by the black-box; and (ii) a good explanation language for graph classification tasks should be represented by higher-order structures, such as motifs. The need to decouple the feature space (edges) from the explanation space (motifs) is thus a major challenge towards developing actionable explanations for graph classification tasks. In this paper we introduce GRAPHSHAP, a Shapley-based approach able to provide motif-based explanations for black-box graph classifiers, assuming no knowledge whatsoever about the model or its training data: the only requirement is that the black-box can be queried at will. Furthermore, we introduce additional auxiliary components such as a synthetic graph dataset generator, algorithms for subgraph mining and ranking, a custom graph convolutional layer, and a kernel to approximate the explanation scores while maintaining linear time complexity. Finally, we test GRAPHSHAP on a real-world brain-network dataset consisting of patients affected by Autism Spectrum Disorder and a control group. Our experiments highlight how the classification provided by a black-box model can be effectively explained by few connectomics patterns.
To trust or not to trust an explanation: using LEAF to evaluate local linear XAI methods
Jun 01, 2021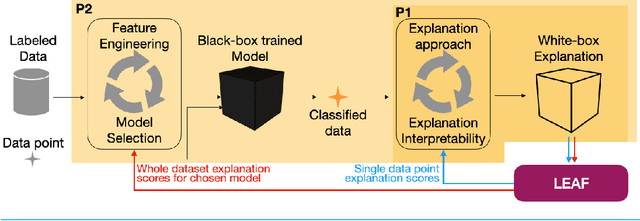


Abstract:The main objective of eXplainable Artificial Intelligence (XAI) is to provide effective explanations for black-box classifiers. The existing literature lists many desirable properties for explanations to be useful, but there is no consensus on how to quantitatively evaluate explanations in practice. Moreover, explanations are typically used only to inspect black-box models, and the proactive use of explanations as a decision support is generally overlooked. Among the many approaches to XAI, a widely adopted paradigm is Local Linear Explanations - with LIME and SHAP emerging as state-of-the-art methods. We show that these methods are plagued by many defects including unstable explanations, divergence of actual implementations from the promised theoretical properties, and explanations for the wrong label. This highlights the need to have standard and unbiased evaluation procedures for Local Linear Explanations in the XAI field. In this paper we address the problem of identifying a clear and unambiguous set of metrics for the evaluation of Local Linear Explanations. This set includes both existing and novel metrics defined specifically for this class of explanations. All metrics have been included in an open Python framework, named LEAF. The purpose of LEAF is to provide a reference for end users to evaluate explanations in a standardised and unbiased way, and to guide researchers towards developing improved explainable techniques.
* 16 pages, 8 figures
FairLens: Auditing Black-box Clinical Decision Support Systems
Nov 08, 2020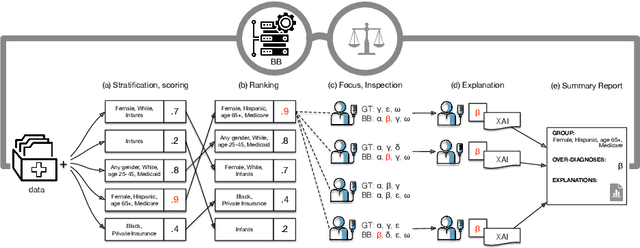


Abstract:The pervasive application of algorithmic decision-making is raising concerns on the risk of unintended bias in AI systems deployed in critical settings such as healthcare. The detection and mitigation of biased models is a very delicate task which should be tackled with care and involving domain experts in the loop. In this paper we introduce FairLens, a methodology for discovering and explaining biases. We show how our tool can be used to audit a fictional commercial black-box model acting as a clinical decision support system. In this scenario, the healthcare facility experts can use FairLens on their own historical data to discover the model's biases before incorporating it into the clinical decision flow. FairLens first stratifies the available patient data according to attributes such as age, ethnicity, gender and insurance; it then assesses the model performance on such subgroups of patients identifying those in need of expert evaluation. Finally, building on recent state-of-the-art XAI (eXplainable Artificial Intelligence) techniques, FairLens explains which elements in patients' clinical history drive the model error in the selected subgroup. Therefore, FairLens allows experts to investigate whether to trust the model and to spotlight group-specific biases that might constitute potential fairness issues.
 Add to Chrome
 Add to Firefox
 Add to Edge