Md Amiruzzaman
Evaluating the Limitations of Local LLMs in Solving Complex Programming Challenges
Sep 18, 2025Abstract:This study examines the performance of today's open-source, locally hosted large-language models (LLMs) in handling complex competitive programming tasks with extended problem descriptions and contexts. Building on the original Framework for AI-driven Code Generation Evaluation (FACE), the authors retrofit the pipeline to work entirely offline through the Ollama runtime, collapsing FACE's sprawling per-problem directory tree into a handful of consolidated JSON files, and adding robust checkpointing so multi-day runs can resume after failures. The enhanced framework generates, submits, and records solutions for the full Kattis corpus of 3,589 problems across eight code-oriented models ranging from 6.7-9 billion parameters. The submission results show that the overall pass@1 accuracy is modest for the local models, with the best models performing at approximately half the acceptance rate of the proprietary models, Gemini 1.5 and ChatGPT-4. These findings expose a persistent gap between private, cost-controlled LLM deployments and state-of-the-art proprietary services, yet also highlight the rapid progress of open models and the practical benefits of an evaluation workflow that organizations can replicate on in-house hardware.
A Tiered GAN Approach for Monet-Style Image Generation
Dec 07, 2024


Abstract:Generative Adversarial Networks (GANs) have proven to be a powerful tool in generating artistic images, capable of mimicking the styles of renowned painters, such as Claude Monet. This paper introduces a tiered GAN model to progressively refine image quality through a multi-stage process, enhancing the generated images at each step. The model transforms random noise into detailed artistic representations, addressing common challenges such as instability in training, mode collapse, and output quality. This approach combines downsampling and convolutional techniques, enabling the generation of high-quality Monet-style artwork while optimizing computational efficiency. Experimental results demonstrate the architecture's ability to produce foundational artistic structures, though further refinements are necessary for achieving higher levels of realism and fidelity to Monet's style. Future work focuses on improving training methodologies and model complexity to bridge the gap between generated and true artistic images. Additionally, the limitations of traditional GANs in artistic generation are analyzed, and strategies to overcome these shortcomings are proposed.
Neural network interpretability with layer-wise relevance propagation: novel techniques for neuron selection and visualization
Dec 07, 2024Abstract:Interpreting complex neural networks is crucial for understanding their decision-making processes, particularly in applications where transparency and accountability are essential. This proposed method addresses this need by focusing on layer-wise Relevance Propagation (LRP), a technique used in explainable artificial intelligence (XAI) to attribute neural network outputs to input features through backpropagated relevance scores. Existing LRP methods often struggle with precision in evaluating individual neuron contributions. To overcome this limitation, we present a novel approach that improves the parsing of selected neurons during LRP backward propagation, using the Visual Geometry Group 16 (VGG16) architecture as a case study. Our method creates neural network graphs to highlight critical paths and visualizes these paths with heatmaps, optimizing neuron selection through accuracy metrics like Mean Squared Error (MSE) and Symmetric Mean Absolute Percentage Error (SMAPE). Additionally, we utilize a deconvolutional visualization technique to reconstruct feature maps, offering a comprehensive view of the network's inner workings. Extensive experiments demonstrate that our approach enhances interpretability and supports the development of more transparent artificial intelligence (AI) systems for computer vision applications. This advancement has the potential to improve the trustworthiness of AI models in real-world machine vision applications, thereby increasing their reliability and effectiveness.
From classical techniques to convolution-based models: A review of object detection algorithms
Dec 06, 2024


Abstract:Object detection is a fundamental task in computer vision and image understanding, with the goal of identifying and localizing objects of interest within an image while assigning them corresponding class labels. Traditional methods, which relied on handcrafted features and shallow models, struggled with complex visual data and showed limited performance. These methods combined low-level features with contextual information and lacked the ability to capture high-level semantics. Deep learning, especially Convolutional Neural Networks (CNNs), addressed these limitations by automatically learning rich, hierarchical features directly from data. These features include both semantic and high-level representations essential for accurate object detection. This paper reviews object detection frameworks, starting with classical computer vision methods. We categorize object detection approaches into two groups: (1) classical computer vision techniques and (2) CNN-based detectors. We compare major CNN models, discussing their strengths and limitations. In conclusion, this review highlights the significant advancements in object detection through deep learning and identifies key areas for further research to improve performance.
Visualizing Routes with AI-Discovered Street-View Patterns
Mar 30, 2024


Abstract:Street-level visual appearances play an important role in studying social systems, such as understanding the built environment, driving routes, and associated social and economic factors. It has not been integrated into a typical geographical visualization interface (e.g., map services) for planning driving routes. In this paper, we study this new visualization task with several new contributions. First, we experiment with a set of AI techniques and propose a solution of using semantic latent vectors for quantifying visual appearance features. Second, we calculate image similarities among a large set of street-view images and then discover spatial imagery patterns. Third, we integrate these discovered patterns into driving route planners with new visualization techniques. Finally, we present VivaRoutes, an interactive visualization prototype, to show how visualizations leveraged with these discovered patterns can help users effectively and interactively explore multiple routes. Furthermore, we conducted a user study to assess the usefulness and utility of VivaRoutes.
Clustering Algorithms to Analyze the Road Traffic Crashes
Aug 07, 2021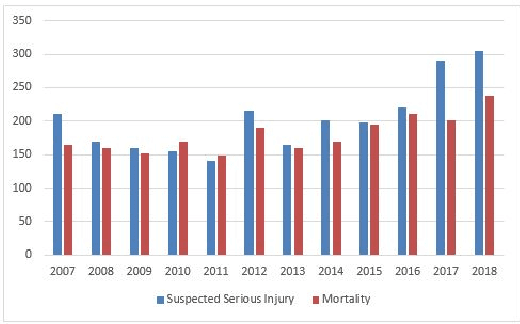
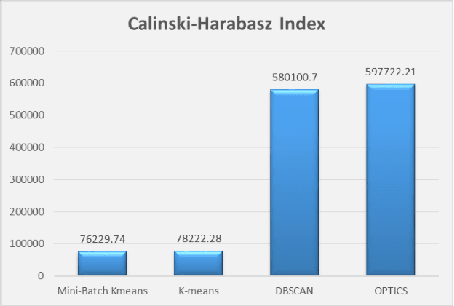
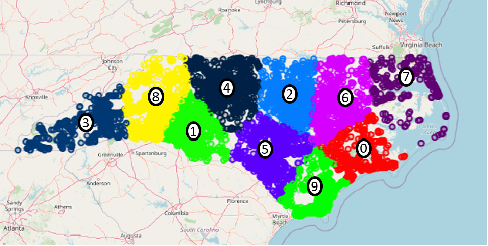
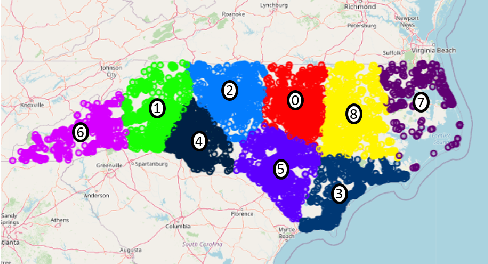
Abstract:Selecting an appropriate clustering method as well as an optimal number of clusters in road accident data is at times confusing and difficult. This paper analyzes shortcomings of different existing techniques applied to cluster accident-prone areas and recommends using Density-Based Spatial Clustering of Applications with Noise (DBSCAN) and Ordering Points To Identify the Clustering Structure (OPTICS) to overcome them. Comparative performance analysis based on real-life data on the recorded cases of road accidents in North Carolina also show more effectiveness and efficiency achieved by these algorithms.
* 6 pages, 10 figures, 2 tables
Data Mining and Visualization to Understand Accident-prone Areas
Mar 11, 2021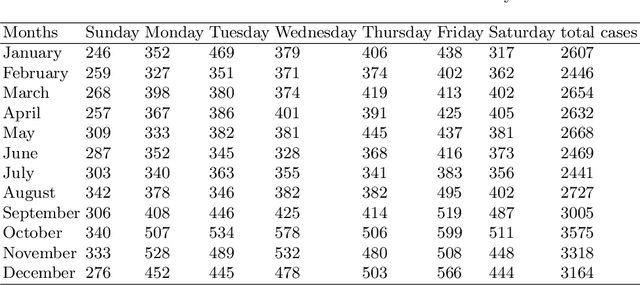
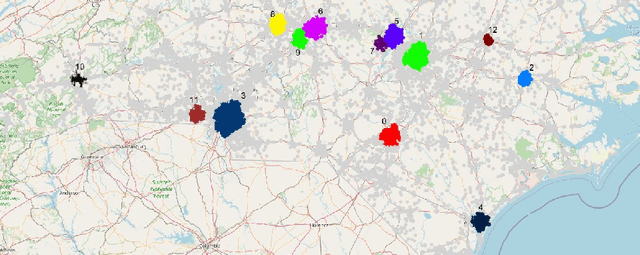
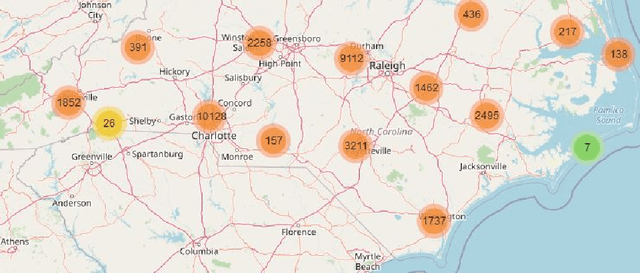
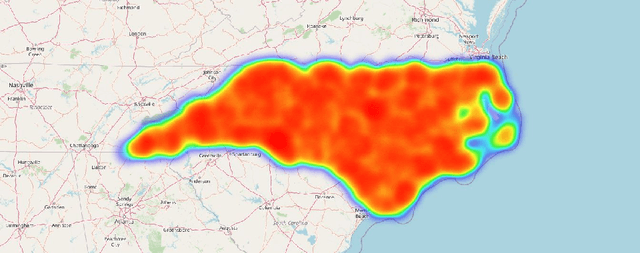
Abstract:In this study, we present both data mining and information visualization techniques to identify accident-prone areas, most accident-prone time, day, and month. Also, we surveyed among volunteers to understand which visualization techniques help non-expert users to understand the findings better. Findings of this study suggest that most accidents occur in the dusk (i.e., between 6 to 7 pm), and on Fridays. Results also suggest that most accidents occurred in October, which is a popular month for tourism. These findings are consistent with social information and can help policymakers, residents, tourists, and other law enforcement agencies. This study can be extended to draw broader implications.
 Add to Chrome
 Add to Firefox
 Add to Edge