Kimberli Zhong
Massachusetts Institute of Technology
Synthetically Trained Icon Proposals for Parsing and Summarizing Infographics
Jul 27, 2018


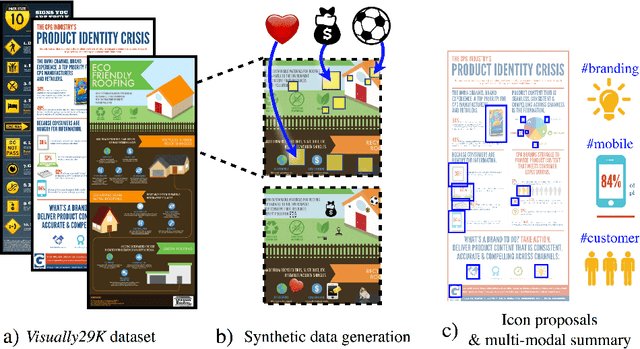
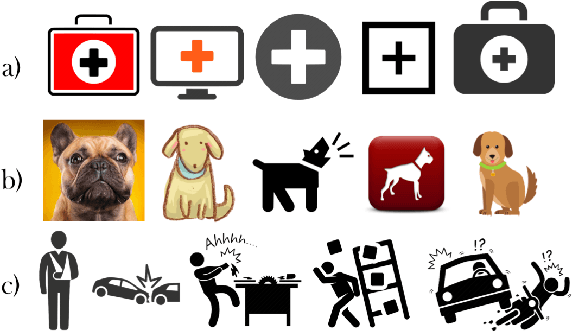
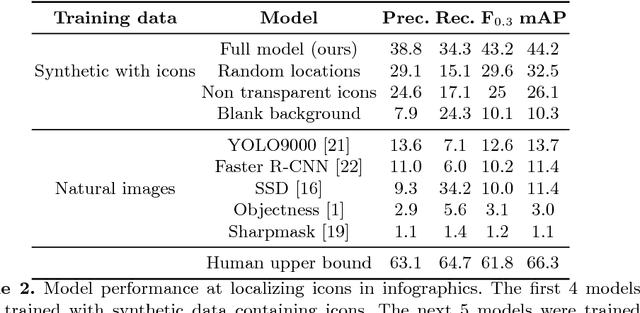
Abstract:Widely used in news, business, and educational media, infographics are handcrafted to effectively communicate messages about complex and often abstract topics including `ways to conserve the environment' and `understanding the financial crisis'. Composed of stylistically and semantically diverse visual and textual elements, infographics pose new challenges for computer vision. While automatic text extraction works well on infographics, computer vision approaches trained on natural images fail to identify the stand-alone visual elements in infographics, or `icons'. To bridge this representation gap, we propose a synthetic data generation strategy: we augment background patches in infographics from our Visually29K dataset with Internet-scraped icons which we use as training data for an icon proposal mechanism. On a test set of 1K annotated infographics, icons are located with 38% precision and 34% recall (the best model trained with natural images achieves 14% precision and 7% recall). Combining our icon proposals with icon classification and text extraction, we present a multi-modal summarization application. Our application takes an infographic as input and automatically produces text tags and visual hashtags that are textually and visually representative of the infographic's topics respectively.
Understanding Infographics through Textual and Visual Tag Prediction
Sep 26, 2017


Abstract:We introduce the problem of visual hashtag discovery for infographics: extracting visual elements from an infographic that are diagnostic of its topic. Given an infographic as input, our computational approach automatically outputs textual and visual elements predicted to be representative of the infographic content. Concretely, from a curated dataset of 29K large infographic images sampled across 26 categories and 391 tags, we present an automated two step approach. First, we extract the text from an infographic and use it to predict text tags indicative of the infographic content. And second, we use these predicted text tags as a supervisory signal to localize the most diagnostic visual elements from within the infographic i.e. visual hashtags. We report performances on a categorization and multi-label tag prediction problem and compare our proposed visual hashtags to human annotations.
 Add to Chrome
 Add to Firefox
 Add to Edge