Jacob Shermeyer
The Multi-Temporal Urban Development SpaceNet Dataset
Feb 08, 2021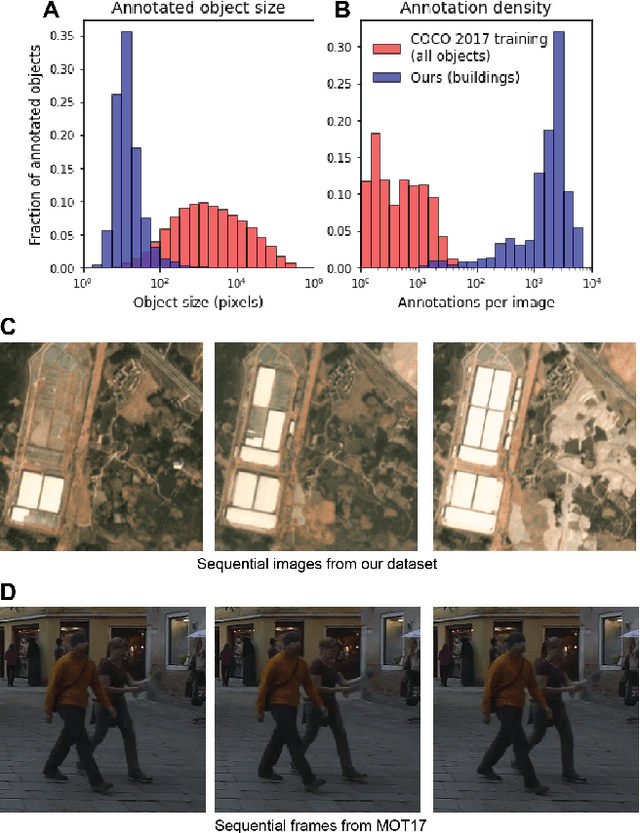

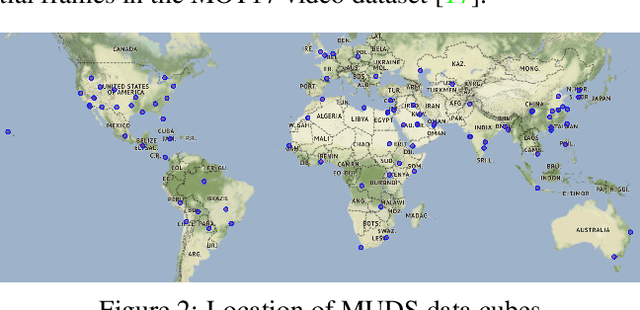
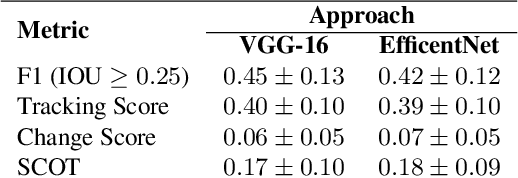
Abstract:Satellite imagery analytics have numerous human development and disaster response applications, particularly when time series methods are involved. For example, quantifying population statistics is fundamental to 67 of the 231 United Nations Sustainable Development Goals Indicators, but the World Bank estimates that over 100 countries currently lack effective Civil Registration systems. To help address this deficit and develop novel computer vision methods for time series data, we present the Multi-Temporal Urban Development SpaceNet (MUDS, also known as SpaceNet 7) dataset. This open source dataset consists of medium resolution (4.0m) satellite imagery mosaics, which includes 24 images (one per month) covering >100 unique geographies, and comprises >40,000 km2 of imagery and exhaustive polygon labels of building footprints therein, totaling over 11M individual annotations. Each building is assigned a unique identifier (i.e. address), which permits tracking of individual objects over time. Label fidelity exceeds image resolution; this "omniscient labeling" is a unique feature of the dataset, and enables surprisingly precise algorithmic models to be crafted. We demonstrate methods to track building footprint construction (or demolition) over time, thereby directly assessing urbanization. Performance is measured with the newly developed SpaceNet Change and Object Tracking (SCOT) metric, which quantifies both object tracking as well as change detection. We demonstrate that despite the moderate resolution of the data, we are able to track individual building identifiers over time. This task has broad implications for disaster preparedness, the environment, infrastructure development, and epidemic prevention.
RarePlanes: Synthetic Data Takes Flight
Jun 04, 2020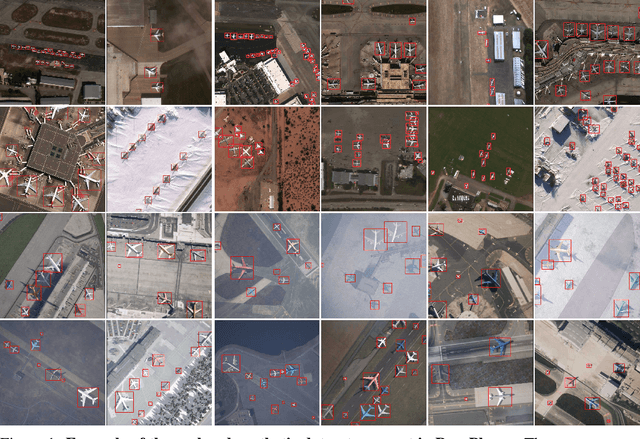


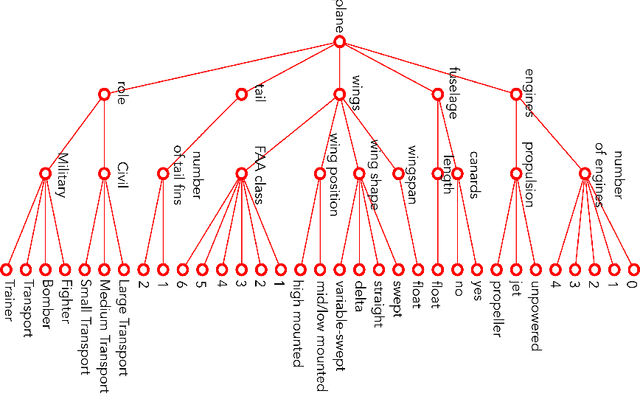
Abstract:RarePlanes is a unique open-source machine learning dataset that incorporates both real and synthetically generated satellite imagery. The RarePlanes dataset specifically focuses on the value of synthetic data to aid computer vision algorithms in their ability to automatically detect aircraft and their attributes in satellite imagery. Although other synthetic/real combination datasets exist, RarePlanes is the largest openly-available very-high resolution dataset built to test the value of synthetic data from an overhead perspective. Previous research has shown that synthetic data can reduce the amount of real training data needed and potentially improve performance for many tasks in the computer vision domain. The real portion of the dataset consists of 253 Maxar WorldView-3 satellite scenes spanning 112 locations and 2,142 km^2 with 14,700 hand-annotated aircraft. The accompanying synthetic dataset is generated via a novel simulation platform and features 50,000 synthetic satellite images with ~630,000 aircraft annotations. Both the real and synthetically generated aircraft feature 10 fine grain attributes including: aircraft length, wingspan, wing-shape, wing-position, wingspan class, propulsion, number of engines, number of vertical-stabilizers, presence of canards, and aircraft role. Finally, we conduct extensive experiments to evaluate the real and synthetic datasets and compare performances. By doing so, we show the value of synthetic data for the task of detecting and classifying aircraft from an overhead perspective.
SpaceNet 6: Multi-Sensor All Weather Mapping Dataset
Apr 14, 2020
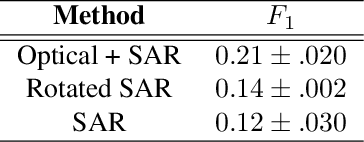
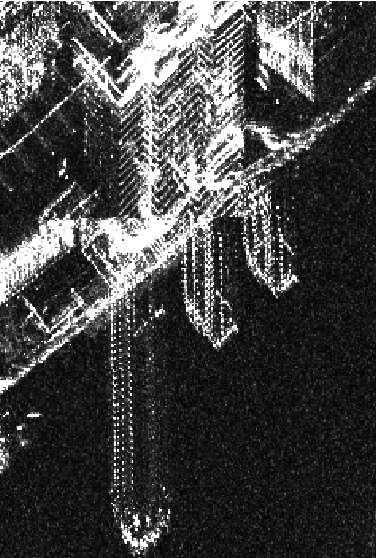
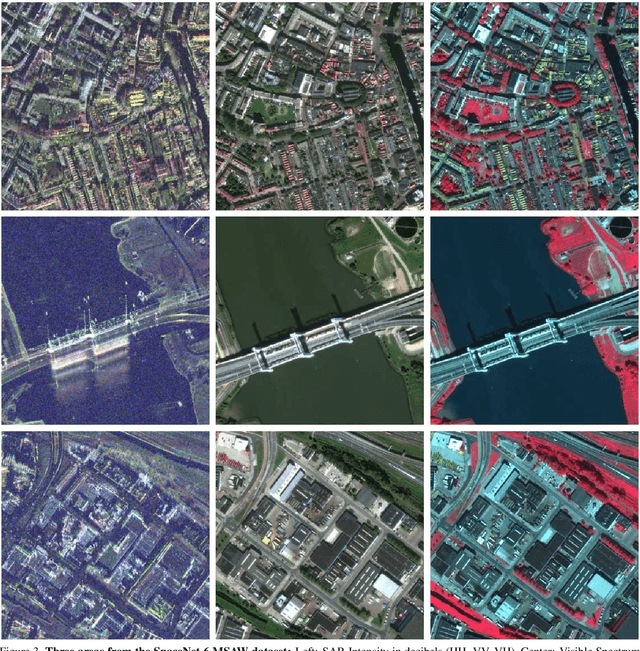
Abstract:Within the remote sensing domain, a diverse set of acquisition modalities exist, each with their own unique strengths and weaknesses. Yet, most of the current literature and open datasets only deal with electro-optical (optical) data for different detection and segmentation tasks at high spatial resolutions. optical data is often the preferred choice for geospatial applications, but requires clear skies and little cloud cover to work well. Conversely, Synthetic Aperture Radar (SAR) sensors have the unique capability to penetrate clouds and collect during all weather, day and night conditions. Consequently, SAR data are particularly valuable in the quest to aid disaster response, when weather and cloud cover can obstruct traditional optical sensors. Despite all of these advantages, there is little open data available to researchers to explore the effectiveness of SAR for such applications, particularly at very-high spatial resolutions, i.e. <1m Ground Sample Distance (GSD). To address this problem, we present an open Multi-Sensor All Weather Mapping (MSAW) dataset and challenge, which features two collection modalities (both SAR and optical). The dataset and challenge focus on mapping and building footprint extraction using a combination of these data sources. MSAW covers 120 km^2 over multiple overlapping collects and is annotated with over 48,000 unique building footprints labels, enabling the creation and evaluation of mapping algorithms for multi-modal data. We present a baseline and benchmark for building footprint extraction with SAR data and find that state-of-the-art segmentation models pre-trained on optical data, and then trained on SAR (F1 score of 0.21) outperform those trained on SAR data alone (F1 score of 0.135).
Road Network and Travel Time Extraction from Multiple Look Angles with SpaceNet Data
Jan 16, 2020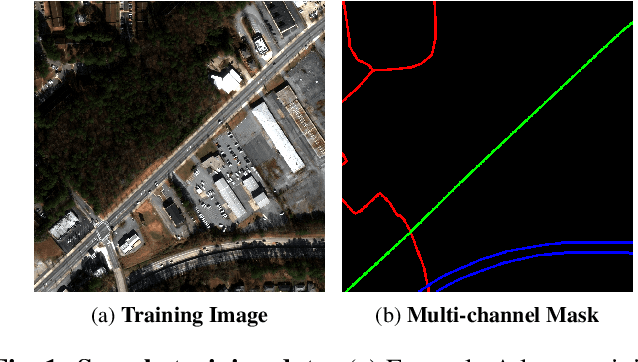


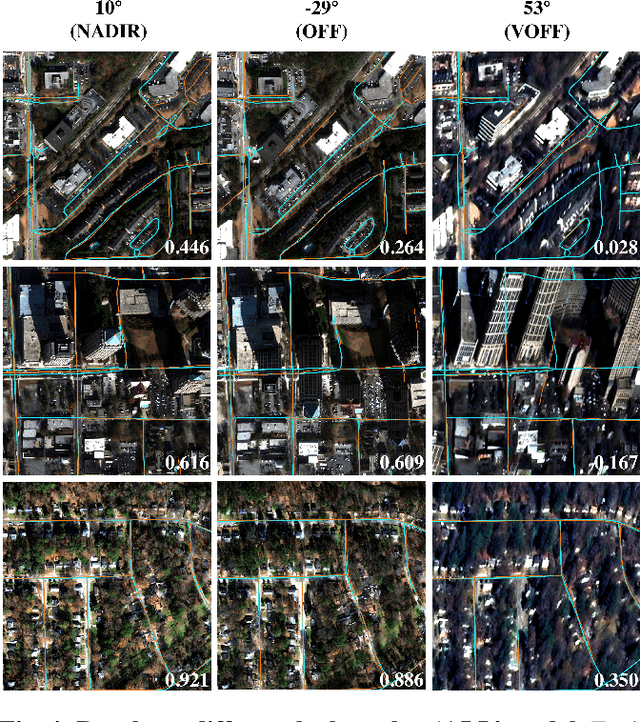
Abstract:Identification of road networks and optimal routes directly from remote sensing is of critical importance to a broad array of humanitarian and commercial applications. Yet while identification of road pixels has been attempted before, estimation of route travel times from overhead imagery remains a novel problem, particularly for off-nadir overhead imagery. To this end, we extract road networks with travel time estimates from the SpaceNet MVOI dataset. Utilizing the CRESIv2 framework, we demonstrate the ability to extract road networks in various observation angles and quantify performance at 27 unique nadir angles with the graph-theoretic APLS_length and APLS_time metrics. A minimal gap of 0.03 between APLS_length and APLS_time scores indicates that our approach yields speed limits and travel times with very high fidelity. We also explore the utility of incorporating all available angles during model training, and find a peak score of APLS_time = 0.56. The combined model exhibits greatly improved robustness over angle-specific models, despite the very different appearance of road networks at extremely oblique off-nadir angles versus images captured from directly overhead.
SpaceNet MVOI: a Multi-View Overhead Imagery Dataset
Mar 28, 2019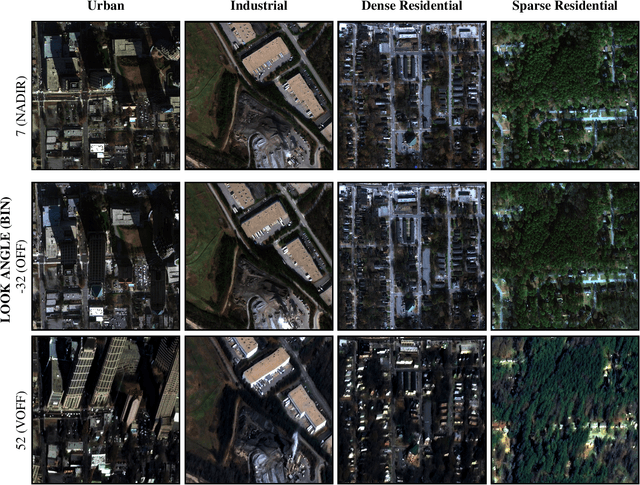

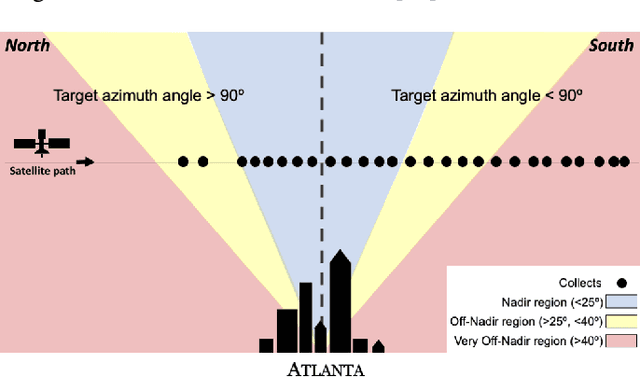

Abstract:Detection and segmentation of objects in overheard imagery is a challenging task. The variable density, random orientation, small size, and instance-to-instance heterogeneity of objects in overhead imagery calls for approaches distinct from existing models designed for natural scene datasets. Though new overhead imagery datasets are being developed, they almost universally comprise a single view taken from directly overhead ("at nadir"), failing to address one critical variable: look angle. By contrast, views vary in real-world overhead imagery, particularly in dynamic scenarios such as natural disasters where first looks are often over 40 degrees off-nadir. This represents an important challenge to computer vision methods, as changing view angle adds distortions, alters resolution, and changes lighting. At present, the impact of these perturbations for algorithmic detection and segmentation of objects is untested. To address this problem, we introduce the SpaceNet Multi-View Overhead Imagery (MVOI) Dataset, an extension of the SpaceNet open source remote sensing dataset. MVOI comprises 27 unique looks from a broad range of viewing angles (-32 to 54 degrees). Each of these images cover the same geography and are annotated with 126,747 building footprint labels, enabling direct assessment of the impact of viewpoint perturbation on model performance. We benchmark multiple leading segmentation and object detection models on: (1) building detection, (2) generalization to unseen viewing angles and resolutions, and (3) sensitivity of building footprint extraction to changes in resolution. We find that segmentation and object detection models struggle to identify buildings in off-nadir imagery and generalize poorly to unseen views, presenting an important benchmark to explore the broadly relevant challenge of detecting small, heterogeneous target objects in visually dynamic contexts.
The Effects of Super-Resolution on Object Detection Performance in Satellite Imagery
Dec 12, 2018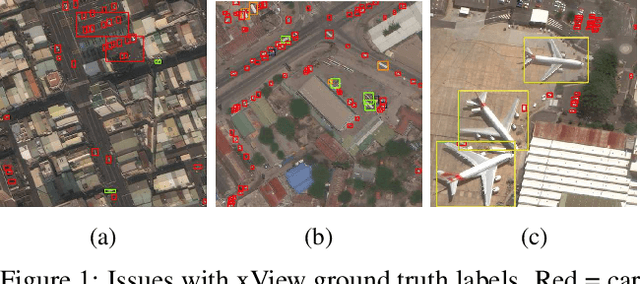
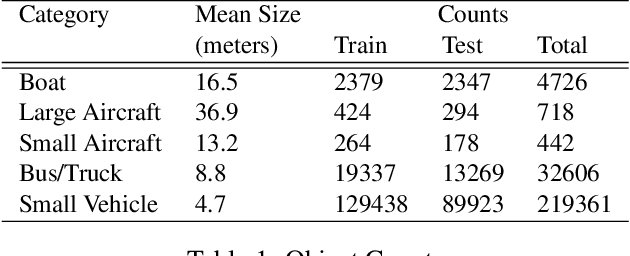
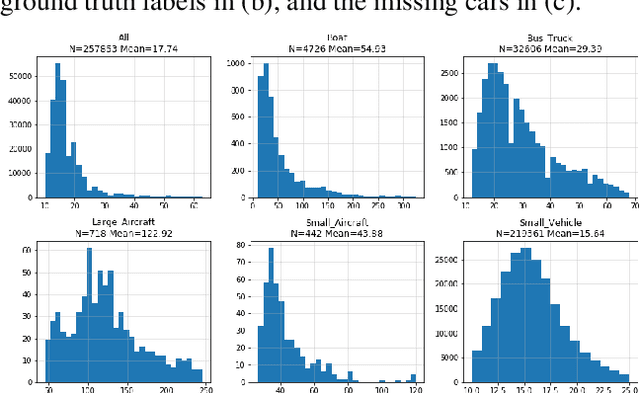
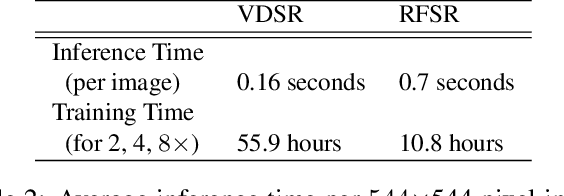
Abstract:We explore the application of super-resolution techniques to satellite imagery, and the effects of these techniques on object detection algorithm performance. Specifically, we enhance satellite imagery beyond its native resolution, and test if we can identify various types of vehicles, planes, and boats with greater accuracy than native resolution. Using the Very Deep Super-Resolution (VDSR) framework and a custom Random Forest Super-Resolution (RFSR) framework we generate enhancement levels of 2x, 4x, and 8x over five distinct resolutions ranging from 30 cm to 4.8 meters. Using both native and super-resolved data, we then train several custom detection models using the SIMRDWN object detection framework. SIMRDWN combines a number of popular object detection algorithms (e.g. SSD, YOLO) into a unified framework that is designed to rapidly detect objects in large satellite images. This approach allows us to quantify the effects of super-resolution techniques on object detection performance across multiple classes and resolutions. We also quantify the performance of object detection as a function of native resolution and object pixel size. For our test set we note that performance degrades from mAP = 0.5 at 30 cm resolution, down to mAP = 0.12 at 4.8 m resolution. Super-resolving native 30 cm imagery to 15 cm yields the greatest benefit; a 16-20% improvement in mAP. Super-resolution is less beneficial at coarser resolutions, though still provides a 3-10% improvement.
Assessment of electrical and infrastructure recovery in Puerto Rico following hurricane Maria using a multisource time series of satellite imagery
Jul 16, 2018Abstract:Puerto Rico suffered severe damage from the category 5 hurricane (Maria) in September 2017. Total monetary damages are estimated to be ~92 billion USD, the third most costly tropical cyclone in US history. The response to this damage has been tempered and slow moving, with recent estimates placing 45% of the population without power three months after the storm. Consequently, we developed a unique data-fusion mapping approach called the Urban Development Index (UDI) and new open source tool, Comet Time Series (CometTS), to analyze the recovery of electricity and infrastructure in Puerto Rico. Our approach incorporates a combination of time series visualizations and change detection mapping to create depictions of power or infrastructure loss. It also provides a unique independent assessment of areas that are still struggling to recover. For this workflow, our time series approach combines nighttime imagery from the Suomi National Polar-orbiting Partnership Visible Infrared Imaging Radiometer Suite (NPP VIIRS), multispectral imagery from two Landsat satellites, US Census data, and crowd-sourced building footprint labels. Based upon our approach we can identify and evaluate: 1) the recovery of electrical power compared to pre-storm levels, 2) the location of potentially damaged infrastructure that has yet to recover from the storm, and 3) the number of persons without power over time. As of May 31, 2018, declined levels of observed brightness across the island indicate that 13.9% +/- ~5.6% of persons still lack power and/or that 13.2% +/- ~5.3% of infrastructure has been lost. In comparison, the Puerto Rico Electric Power Authority states that less than 1% of their customers still are without power.
 Add to Chrome
 Add to Firefox
 Add to Edge