Hanan Samet
Using dynamic circles and squares to visualize spatio-temporal variation
Nov 11, 2022Abstract:Visualizations such as bar charts, scatter plots, and objects on geographical maps often convey critical information, including exact and relative numeric values, using shapes. The choice of shape and method of encoding information is often arbitrarily, or based on convention. However, past studies have shown that the human eye can be fooled by visual representations. The Ebbinghaus illusion demonstrates that the perceived relative sizes of shapes depends on their configuration, which in turn can affect judgements, especially in visualizations like proportional symbol maps. In this study we evaluate the effects of varying the type of shapes and metrics for encoding data in visual representations on a spatio-temporal map interface. We find that some combinations of shape and metric are more conducive to accurate human judgements than others, and provide recommendations for applying these findings in future visualization designs.
CoronaViz: Visualizing Multilayer Spatiotemporal COVID-19 Data with Animated Geocircles
Nov 10, 2022Abstract:While many dashboards for visualizing COVID-19 data exist, most separate geospatial and temporal data into discrete visualizations or tables. Further, the common use of choropleth maps or space-filling map overlays supports only a single geospatial variable at once, making it difficult to compare the temporal and geospatial trends of multiple, potentially interacting variables, such as active cases, deaths, and vaccinations. We present CoronaViz, a COVID-19 visualization system that conveys multilayer, spatiotemporal data in a single, interactive display. CoronaViz encodes variables with concentric, hollow circles, termed geocircles, allowing multiple variables via color encoding and avoiding occlusion problems. The radii of geocircles relate to the values of the variables they represent via the psychophysically determined Flannery formula. The time dimension of spatiotemporal variables is encoded with sequential rendering. Animation controls allow the user to seek through time manually or to view the pandemic unfolding in accelerated time. An adjustable time window allows aggregation at any granularity, from single days to cumulative values for the entire available range. In addition to describing the CoronaViz system, we report findings from a user study comparing CoronaViz with multi-view dashboards from the New York Times and Johns Hopkins University. While participants preferred using the latter two dashboards to perform queries with only a geospatial component or only a temporal component, participants uniformly preferred CoronaViz for queries with both spatial and temporal components, highlighting the utility of a unified spatiotemporal encoding. CoronaViz is open-source and freely available at http://coronaviz.umiacs.io.
Training Quantized Nets: A Deeper Understanding
Nov 13, 2017

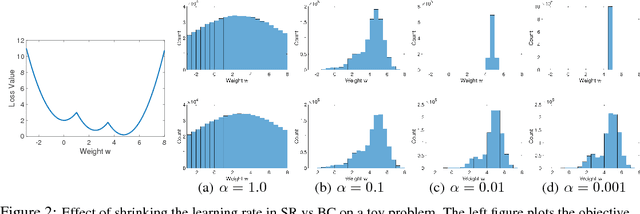
Abstract:Currently, deep neural networks are deployed on low-power portable devices by first training a full-precision model using powerful hardware, and then deriving a corresponding low-precision model for efficient inference on such systems. However, training models directly with coarsely quantized weights is a key step towards learning on embedded platforms that have limited computing resources, memory capacity, and power consumption. Numerous recent publications have studied methods for training quantized networks, but these studies have mostly been empirical. In this work, we investigate training methods for quantized neural networks from a theoretical viewpoint. We first explore accuracy guarantees for training methods under convexity assumptions. We then look at the behavior of these algorithms for non-convex problems, and show that training algorithms that exploit high-precision representations have an important greedy search phase that purely quantized training methods lack, which explains the difficulty of training using low-precision arithmetic.
Pruning Filters for Efficient ConvNets
Mar 10, 2017
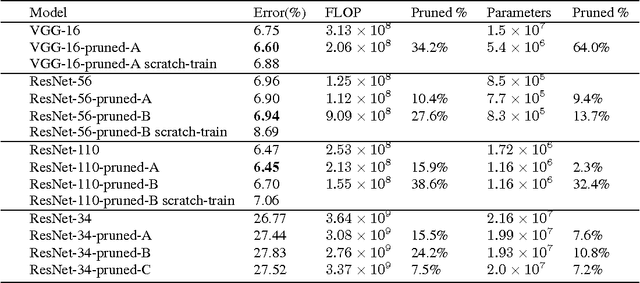
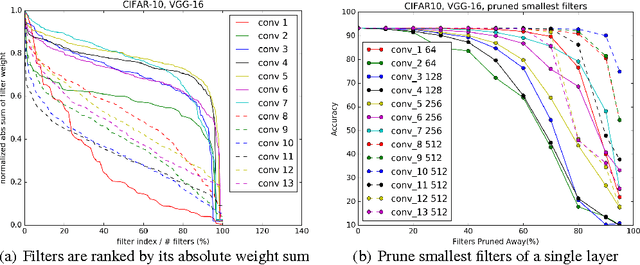
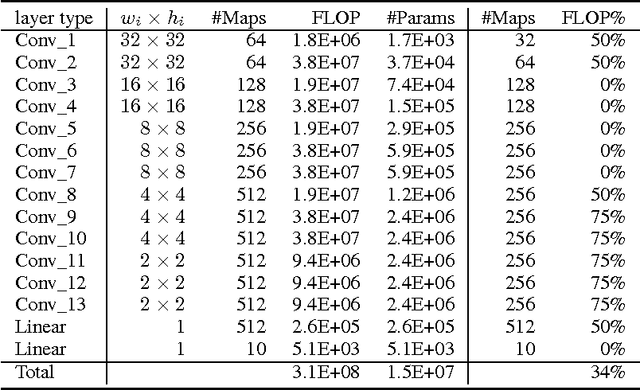
Abstract:The success of CNNs in various applications is accompanied by a significant increase in the computation and parameter storage costs. Recent efforts toward reducing these overheads involve pruning and compressing the weights of various layers without hurting original accuracy. However, magnitude-based pruning of weights reduces a significant number of parameters from the fully connected layers and may not adequately reduce the computation costs in the convolutional layers due to irregular sparsity in the pruned networks. We present an acceleration method for CNNs, where we prune filters from CNNs that are identified as having a small effect on the output accuracy. By removing whole filters in the network together with their connecting feature maps, the computation costs are reduced significantly. In contrast to pruning weights, this approach does not result in sparse connectivity patterns. Hence, it does not need the support of sparse convolution libraries and can work with existing efficient BLAS libraries for dense matrix multiplications. We show that even simple filter pruning techniques can reduce inference costs for VGG-16 by up to 34% and ResNet-110 by up to 38% on CIFAR10 while regaining close to the original accuracy by retraining the networks.
 Add to Chrome
 Add to Firefox
 Add to Edge