Dirk Tiede
Estimation of Physical Parameters of Waveforms With Neural Networks
Dec 05, 2023


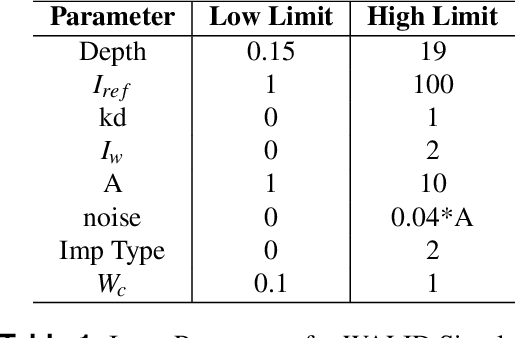
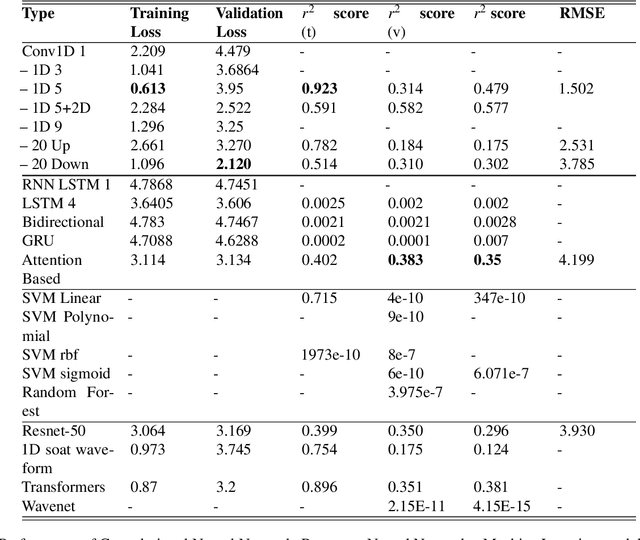
Abstract:Light Detection and Ranging (LiDAR) are fast emerging sensors in the field of Earth Observation. It is a remote sensing technology that utilizes laser beams to measure distances and create detailed three-dimensional representations of objects and environments. The potential of Full Waveform LiDAR is much greater than just height estimation and 3D reconstruction only. Overall shape of signal provides important information about properties of water body. However, the shape of FWL is unexplored as most LiDAR software work on point cloud by utilizing the maximum value within the waveform. Existing techniques in the field of LiDAR data analysis include depth estimation through inverse modeling and regression of logarithmic intensity and depth for approximating the attenuation coefficient. However, these methods suffer from limitations in accuracy. Depth estimation through inverse modeling provides only approximate values and does not account for variations in surface properties, while the regression approach for the attenuation coefficient is only able to generalize a value through several data points which lacks precision and may lead to significant errors in estimation. Additionally, there is currently no established modeling method available for predicting bottom reflectance. This research proposed a novel solution based on neural networks for parameter estimation in LIDAR data analysis. By leveraging the power of neural networks, the proposed solution successfully learned the inversion model, was able to do prediction of parameters such as depth, attenuation coefficient, and bottom reflectance. Performance of model was validated by testing it on real LiDAR data. In future, more data availability would enable more accuracy and reliability of such models.
CroCo: Cross-Modal Contrastive learning for localization of Earth Observation data
Apr 14, 2022


Abstract:It is of interest to localize a ground-based LiDAR point cloud on remote sensing imagery. In this work, we tackle a subtask of this problem, i.e. to map a digital elevation model (DEM) rasterized from aerial LiDAR point cloud on the aerial imagery. We proposed a contrastive learning-based method that trains on DEM and high-resolution optical imagery and experiment the framework on different data sampling strategies and hyperparameters. In the best scenario, the Top-1 score of 0.71 and Top-5 score of 0.81 are obtained. The proposed method is promising for feature learning from RGB and DEM for localization and is potentially applicable to other data sources too. Source code will be released at https://github.com/wtseng530/AVLocalization.
Automated Linear-Time Detection and Quality Assessment of Superpixels in Uncalibrated True- or False-Color RGB Images
Jan 08, 2017


Abstract:Capable of automated near real time superpixel detection and quality assessment in an uncalibrated monitor typical red green blue (RGB) image, depicted in either true or false colors, an original low level computer vision (CV) lightweight computer program, called RGB Image Automatic Mapper (RGBIAM), is designed and implemented. Constrained by the Calibration Validation (CalVal) requirements of the Quality Assurance Framework for Earth Observation (QA4EO) guidelines, RGBIAM requires as mandatory an uncalibrated RGB image pre processing first stage, consisting of an automated statistical model based color constancy algorithm. The RGBIAM hybrid inference pipeline comprises: (I) a direct quantitative to nominal (QN) RGB variable transform, where RGB pixel values are mapped onto a prior dictionary of color names, equivalent to a static polyhedralization of the RGB cube. Prior color naming is the deductive counterpart of inductive vector quantization (VQ), whose typical VQ error function to minimize is a root mean square error (RMSE). In the output multi level color map domain, superpixels are automatically detected in linear time as connected sets of pixels featuring the same color label. (II) An inverse nominal to quantitative (NQ) RGB variable transform, where a superpixelwise constant RGB image approximation is generated in linear time to assess a VQ error image. The hybrid direct and inverse RGBIAM QNQ transform is: (i) general purpose, data and application independent. (ii) Automated, i.e., it requires no user machine interaction. (iii) Near real time, with a computational complexity increasing linearly with the image size. (iv) Implemented in tile streaming mode, to cope with massive images. Collected outcome and process quality indicators, including degree of automation, computational efficiency, VQ rate and VQ error, are consistent with theoretical expectations.
Stage 4 validation of the Satellite Image Automatic Mapper lightweight computer program for Earth observation Level 2 product generation, Part 2 Validation
Jan 08, 2017


Abstract:The European Space Agency (ESA) defines an Earth Observation (EO) Level 2 product as a multispectral (MS) image corrected for geometric, atmospheric, adjacency and topographic effects, stacked with its scene classification map (SCM) whose legend includes quality layers such as cloud and cloud-shadow. No ESA EO Level 2 product has ever been systematically generated at the ground segment. To contribute toward filling an information gap from EO big sensory data to the ESA EO Level 2 product, a Stage 4 validation (Val) of an off the shelf Satellite Image Automatic Mapper (SIAM) lightweight computer program for prior knowledge based MS color naming was conducted by independent means. A time-series of annual Web Enabled Landsat Data (WELD) image composites of the conterminous U.S. (CONUS) was selected as input dataset. The annual SIAM WELD maps of the CONUS were validated in comparison with the U.S. National Land Cover Data (NLCD) 2006 map. These test and reference maps share the same spatial resolution and spatial extent, but their map legends are not the same and must be harmonized. For the sake of readability this paper is split into two. The previous Part 1 Theory provided the multidisciplinary background of a priori color naming. The present Part 2 Validation presents and discusses Stage 4 Val results collected from the test SIAM WELD map time series and the reference NLCD map by an original protocol for wall to wall thematic map quality assessment without sampling, where the test and reference map legends can differ in agreement with the Part 1. Conclusions are that the SIAM-WELD maps instantiate a Level 2 SCM product whose legend is the FAO Land Cover Classification System (LCCS) taxonomy at the Dichotomous Phase (DP) Level 1 vegetation/nonvegetation, Level 2 terrestrial/aquatic or superior LCCS level.
Stage 4 validation of the Satellite Image Automatic Mapper lightweight computer program for Earth observation Level 2 product generation, Part 1 Theory
Jan 08, 2017


Abstract:The European Space Agency (ESA) defines an Earth Observation (EO) Level 2 product as a multispectral (MS) image corrected for geometric, atmospheric, adjacency and topographic effects, stacked with its scene classification map (SCM), whose legend includes quality layers such as cloud and cloud-shadow. No ESA EO Level 2 product has ever been systematically generated at the ground segment. To contribute toward filling an information gap from EO big data to the ESA EO Level 2 product, an original Stage 4 validation (Val) of the Satellite Image Automatic Mapper (SIAM) lightweight computer program was conducted by independent means on an annual Web-Enabled Landsat Data (WELD) image composite time-series of the conterminous U.S. The core of SIAM is a one pass prior knowledge based decision tree for MS reflectance space hyperpolyhedralization into static color names presented in literature in recent years. For the sake of readability this paper is split into two. The present Part 1 Theory provides the multidisciplinary background of a priori color naming in cognitive science, from linguistics to computer vision. To cope with dictionaries of MS color names and land cover class names that do not coincide and must be harmonized, an original hybrid guideline is proposed to identify a categorical variable pair relationship. An original quantitative measure of categorical variable pair association is also proposed. The subsequent Part 2 Validation discusses Stage 4 Val results collected by an original protocol for wall-to-wall thematic map quality assessment without sampling where the test and reference map legends can differ. Conclusions are that the SIAM-WELD maps instantiate a Level 2 SCM product whose legend is the 4 class taxonomy of the FAO Land Cover Classification System at the Dichotomous Phase Level 1 vegetation/nonvegetation and Level 2 terrestrial/aquatic.
 Add to Chrome
 Add to Firefox
 Add to Edge