Diana Paez
A new method of modeling the multi-stage decision-making process of CRT using machine learning with uncertainty quantification
Sep 19, 2023


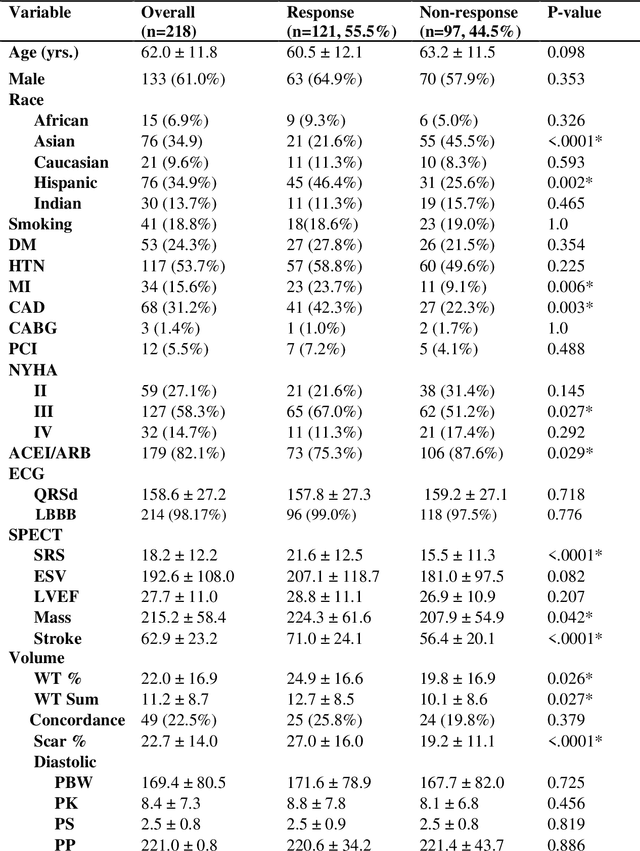
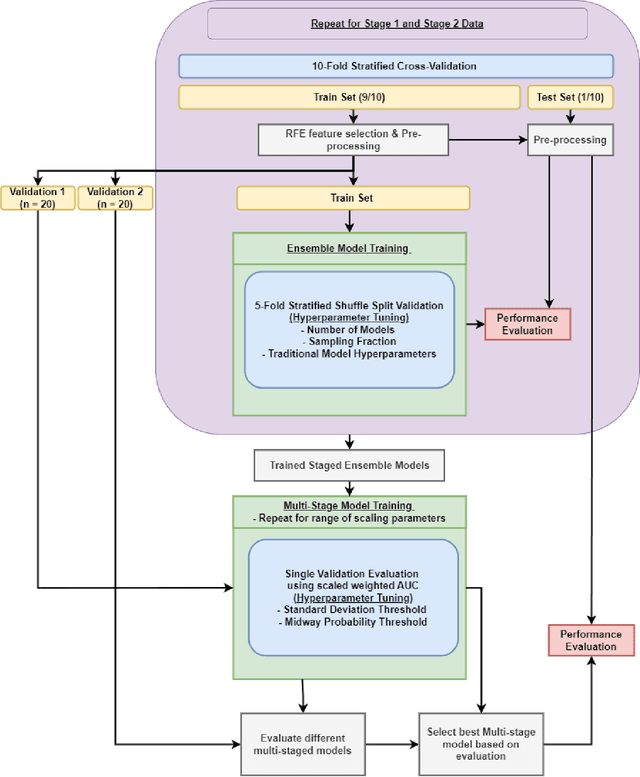
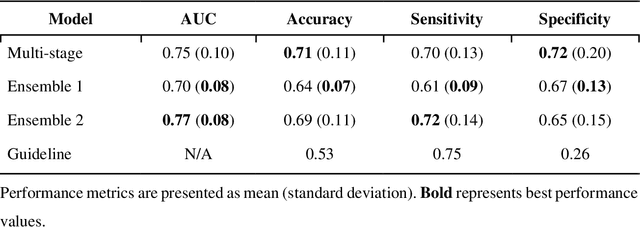
Abstract:Aims. The purpose of this study is to create a multi-stage machine learning model to predict cardiac resynchronization therapy (CRT) response for heart failure (HF) patients. This model exploits uncertainty quantification to recommend additional collection of single-photon emission computed tomography myocardial perfusion imaging (SPECT MPI) variables if baseline clinical variables and features from electrocardiogram (ECG) are not sufficient. Methods. 218 patients who underwent rest-gated SPECT MPI were enrolled in this study. CRT response was defined as an increase in left ventricular ejection fraction (LVEF) > 5% at a 6 month follow-up. A multi-stage ML model was created by combining two ensemble models. Results. The response rate for CRT was 55.5% (n = 121) with overall male gender 61.0% (n = 133), an average age of 62.0, and LVEF of 27.7. The multi-stage model performed similarly to Ensemble 2 (which utilized the additional SPECT data) with AUC of 0.75 vs. 0.77, accuracy of 0.71 vs. 0.69, sensitivity of 0.70 vs. 0.72, and specificity 0.72 vs. 0.65, respectively. However, the multi-stage model only required SPECT MPI data for 52.7% of the patients across all folds. Conclusions. By using rule-based logic stemming from uncertainty quantification, the multi-stage model was able to reduce the need for additional SPECT MPI data acquisition without sacrificing performance.
A new method using machine learning to integrate ECG and gated SPECT MPI for Cardiac Resynchronization Therapy Decision Support on behalf of the VISION-CRT
Nov 06, 2022Abstract:Cardiac resynchronization therapy (CRT) has been established as an important therapy for heart failure. Mechanical dyssynchrony has the potential to predict responders to CRT. The aim of this study was to report the development and the validation of machine learning (ML) models which integrates ECG, gated SPECT MPI (GMPS) and clinical variables to predict patients' response to CRT. This analysis included 153 patients who met criteria for CRT from a prospective cohort study. The variables were used to modeling predictive methods for CRT. Patients were classified as responders for an increase of LVEF>=5% at follow-up. In a second analysis, patients were classified super-responders for increase of LVEF>=15%. For ML, variable selection was applied, and Prediction Analysis of Microarrays (PAM) approach was used for response modeling while Naive Bayes (NB) was used for super-response. They were compared to models obtained with guideline variables. PAM had AUC of 0.80 against 0.71 of logistic regression with guideline variables (p = 0.47). The sensitivity (0.86) and specificity (0.75) were better than for guideline alone, sensitivity (0.72) and specificity (0.22). Neural network with guideline variables outperformed NB (AUC = 0.87 vs 0.86; p = 0.88). Its sensitivity and specificity (1.0 and 0.75, respectively) was better than guideline alone (0.40 and 0.06, respectively). Compared to guideline criteria, ML methods trended towards improved CRT response and super-response prediction. GMPS had a central role in the acquisition of most parameters. Further studies are needed to validate the models.
 Add to Chrome
 Add to Firefox
 Add to Edge