David L. Wilson
AI prediction of cardiovascular events using opportunistic epicardial adipose tissue assessments from CT calcium score
Jan 29, 2024


Abstract:Background: Recent studies have used basic epicardial adipose tissue (EAT) assessments (e.g., volume and mean HU) to predict risk of atherosclerosis-related, major adverse cardiovascular events (MACE). Objectives: Create novel, hand-crafted EAT features, 'fat-omics', to capture the pathophysiology of EAT and improve MACE prediction. Methods: We segmented EAT using a previously-validated deep learning method with optional manual correction. We extracted 148 radiomic features (morphological, spatial, and intensity) and used Cox elastic-net for feature reduction and prediction of MACE. Results: Traditional fat features gave marginal prediction (EAT-volume/EAT-mean-HU/ BMI gave C-index 0.53/0.55/0.57, respectively). Significant improvement was obtained with 15 fat-omics features (C-index=0.69, test set). High-risk features included volume-of-voxels-having-elevated-HU-[-50, -30-HU] and HU-negative-skewness, both of which assess high HU, which as been implicated in fat inflammation. Other high-risk features include kurtosis-of-EAT-thickness, reflecting the heterogeneity of thicknesses, and EAT-volume-in-the-top-25%-of-the-heart, emphasizing adipose near the proximal coronary arteries. Kaplan-Meyer plots of Cox-identified, high- and low-risk patients were well separated with the median of the fat-omics risk, while high-risk group having HR 2.4 times that of the low-risk group (P<0.001). Conclusion: Preliminary findings indicate an opportunity to use more finely tuned, explainable assessments on EAT for improved cardiovascular risk prediction.
Pericoronary adipose tissue feature analysis in CT calcium score images with comparison to coronary CTA
Jan 28, 2024


Abstract:We investigated the feasibility and advantages of using non-contrast CT calcium score (CTCS) images to assess pericoronary adipose tissue (PCAT) and its association with major adverse cardiovascular events (MACE). PCAT features from coronary CTA (CCTA) have been shown to be associated with cardiovascular risk but are potentially confounded by iodine. If PCAT in CTCS images can be similarly analyzed, it would avoid this issue and enable its inclusion in formal risk assessment from readily available, low-cost CTCS images. To identify coronaries in CTCS images that have subtle visual evidence of vessels, we registered CTCS with paired CCTA images having coronary labels. We developed a novel axial-disk method giving regions for analyzing PCAT features in three main coronary arteries. We analyzed novel hand-crafted and radiomic features using univariate and multivariate logistic regression prediction of MACE and compared results against those from CCTA. Registration accuracy was sufficient to enable the identification of PCAT regions in CTCS images. Motion or beam hardening artifacts were often present in high-contrast CCTA but not CTCS. Mean HU and volume were increased in both CTCS and CCTA for MACE group. There were significant positive correlations between some CTCS and CCTA features, suggesting that similar characteristics were obtained. Using hand-crafted/radiomics from CTCS and CCTA, AUCs were 0.82/0.79 and 0.83/0.77 respectively, while Agatston gave AUC=0.73. Preliminarily, PCAT features can be assessed from three main coronary arteries in non-contrast CTCS images with performance characteristics that are at the very least comparable to CCTA.
Deep learning segmentation of fibrous cap in intravascular optical coherence tomography images
Nov 10, 2023Abstract:Thin-cap fibroatheroma (TCFA) is a prominent risk factor for plaque rupture. Intravascular optical coherence tomography (IVOCT) enables identification of fibrous cap (FC), measurement of FC thicknesses, and assessment of plaque vulnerability. We developed a fully-automated deep learning method for FC segmentation. This study included 32,531 images across 227 pullbacks from two registries. Images were semi-automatically labeled using our OCTOPUS with expert editing using established guidelines. We employed preprocessing including guidewire shadow detection, lumen segmentation, pixel-shifting, and Gaussian filtering on raw IVOCT (r,theta) images. Data were augmented in a natural way by changing theta in spiral acquisitions and by changing intensity and noise values. We used a modified SegResNet and comparison networks to segment FCs. We employed transfer learning from our existing much larger, fully-labeled calcification IVOCT dataset to reduce deep-learning training. Overall, our method consistently delivered better FC segmentation results (Dice: 0.837+/-0.012) than other deep-learning methods. Transfer learning reduced training time by 84% and reduced the need for more training samples. Our method showed a high level of generalizability, evidenced by highly-consistent segmentations across five-fold cross-validation (sensitivity: 85.0+/-0.3%, Dice: 0.846+/-0.011) and the held-out test (sensitivity: 84.9%, Dice: 0.816) sets. In addition, we found excellent agreement of FC thickness with ground truth (2.95+/-20.73 um), giving clinically insignificant bias. There was excellent reproducibility in pre- and post-stenting pullbacks (average FC angle: 200.9+/-128.0 deg / 202.0+/-121.1 deg). Our method will be useful for multiple research purposes and potentially for planning stent deployments that avoid placing a stent edge over an FC.
Enhancing cardiovascular risk prediction through AI-enabled calcium-omics
Aug 23, 2023


Abstract:Background. Coronary artery calcium (CAC) is a powerful predictor of major adverse cardiovascular events (MACE). Traditional Agatston score simply sums the calcium, albeit in a non-linear way, leaving room for improved calcification assessments that will more fully capture the extent of disease. Objective. To determine if AI methods using detailed calcification features (i.e., calcium-omics) can improve MACE prediction. Methods. We investigated additional features of calcification including assessment of mass, volume, density, spatial distribution, territory, etc. We used a Cox model with elastic-net regularization on 2457 CT calcium score (CTCS) enriched for MACE events obtained from a large no-cost CLARIFY program (ClinicalTri-als.gov Identifier: NCT04075162). We employed sampling techniques to enhance model training. We also investigated Cox models with selected features to identify explainable high-risk characteristics. Results. Our proposed calcium-omics model with modified synthetic down sampling and up sampling gave C-index (80.5%/71.6%) and two-year AUC (82.4%/74.8%) for (80:20, training/testing), respectively (sampling was applied to the training set only). Results compared favorably to Agatston which gave C-index (71.3%/70.3%) and AUC (71.8%/68.8%), respectively. Among calcium-omics features, numbers of calcifications, LAD mass, and diffusivity (a measure of spatial distribution) were important determinants of increased risk, with dense calcification (>1000HU) associated with lower risk. The calcium-omics model reclassified 63% of MACE patients to the high risk group in a held-out test. The categorical net-reclassification index was NRI=0.153. Conclusions. AI analysis of coronary calcification can lead to improved results as compared to Agatston scoring. Our findings suggest the utility of calcium-omics in improved prediction of risk.
Cardiac CT perfusion imaging of pericoronary adipose tissue (PCAT) highlights potential confounds in coronary CTA
Jun 27, 2023Abstract:Features of pericoronary adipose tissue (PCAT) assessed from coronary computed tomography angiography (CCTA) are associated with inflammation and cardiovascular risk. As PCAT is vascularly connected with coronary vasculature, the presence of iodine is a potential confounding factor on PCAT HU and textures that has not been adequately investigated. Use dynamic cardiac CT perfusion (CCTP) to inform contrast determinants of PCAT assessment. From CCTP, we analyzed HU dynamics of territory-specific PCAT, myocardium, and other adipose depots in patients with coronary artery disease. HU, blood flow, and radiomics were assessed over time. Changes from peak aorta time, Pa, chosen to model the time of CCTA, were obtained. HU in PCAT increased more than in other adipose depots. The estimated blood flow in PCAT was ~23% of that in the contiguous myocardium. Comparing PCAT distal and proximal to a significant stenosis, we found less enhancement and longer time-to-peak distally. Two-second offsets [before, after] Pa resulted in [ 4-HU, 3-HU] differences in PCAT. Due to changes in HU, the apparent PCAT volume reduced ~15% from the first scan (P1) to Pa using a conventional fat window. Comparing radiomic features over time, 78% of features changed >10% relative to P1. CCTP elucidates blood flow in PCAT and enables analysis of PCAT features over time. PCAT assessments (HU, apparent volume, and radiomics) are sensitive to acquisition timing and the presence of obstructive stenosis, which may confound the interpretation of PCAT in CCTA images. Data normalization may be in order.
Automated segmentation of microvessels in intravascular OCT images using deep learning
Oct 01, 2022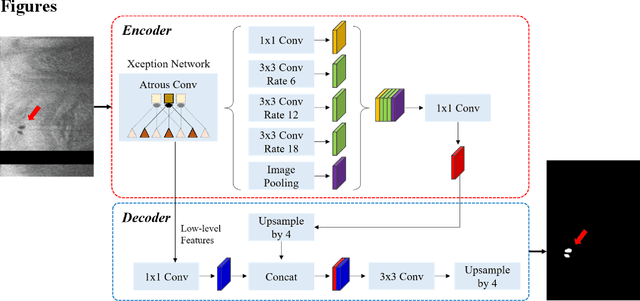


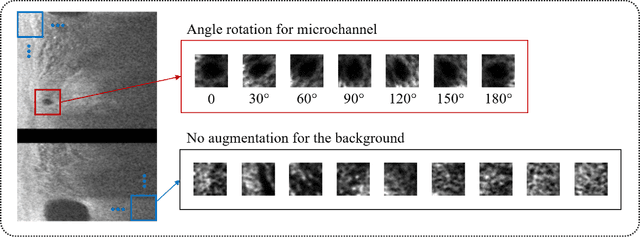
Abstract:To analyze this characteristic of vulnerability, we developed an automated deep learning method for detecting microvessels in intravascular optical coherence tomography (IVOCT) images. A total of 8,403 IVOCT image frames from 85 lesions and 37 normal segments were analyzed. Manual annotation was done using a dedicated software (OCTOPUS) previously developed by our group. Data augmentation in the polar (r,{\theta}) domain was applied to raw IVOCT images to ensure that microvessels appear at all possible angles. Pre-processing methods included guidewire/shadow detection, lumen segmentation, pixel shifting, and noise reduction. DeepLab v3+ was used to segment microvessel candidates. A bounding box on each candidate was classified as either microvessel or non-microvessel using a shallow convolutional neural network. For better classification, we used data augmentation (i.e., angle rotation) on bounding boxes with a microvessel during network training. Data augmentation and pre-processing steps improved microvessel segmentation performance significantly, yielding a method with Dice of 0.71+/-0.10 and pixel-wise sensitivity/specificity of 87.7+/-6.6%/99.8+/-0.1%. The network for classifying microvessels from candidates performed exceptionally well, with sensitivity of 99.5+/-0.3%, specificity of 98.8+/-1.0%, and accuracy of 99.1+/-0.5%. The classification step eliminated the majority of residual false positives, and the Dice coefficient increased from 0.71 to 0.73. In addition, our method produced 698 image frames with microvessels present, compared to 730 from manual analysis, representing a 4.4% difference. When compared to the manual method, the automated method improved microvessel continuity, implying improved segmentation performance. The method will be useful for research purposes as well as potential future treatment planning.
Prediction of stent under-expansion in calcified coronary arteries using machine-learning on intravascular optical coherence tomography
May 16, 2022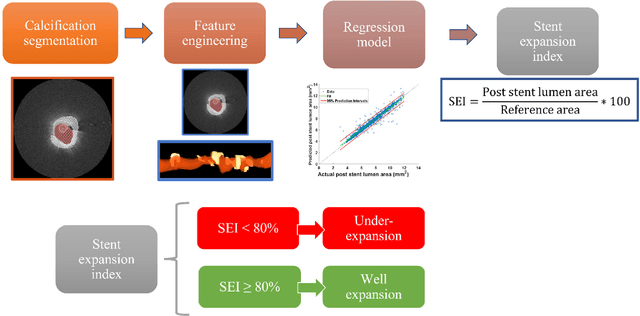
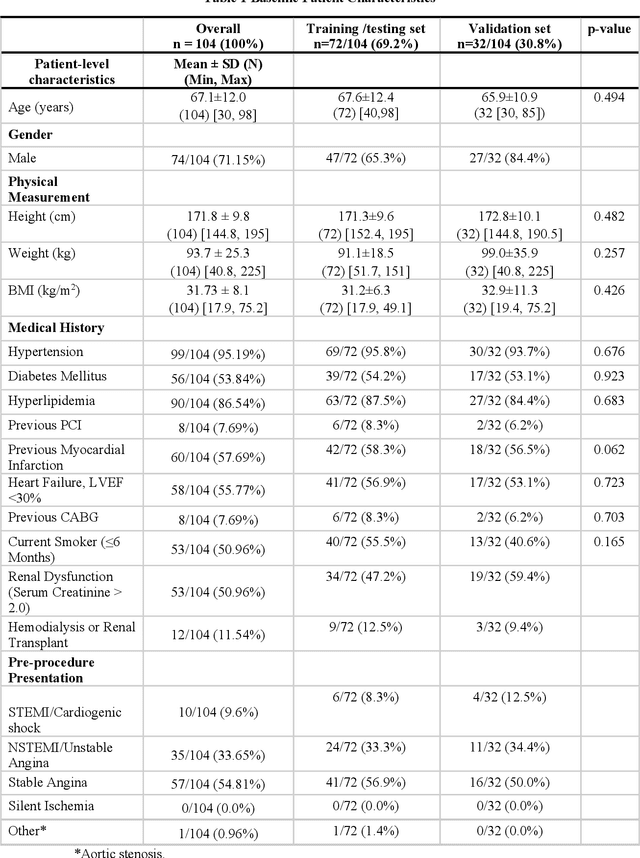
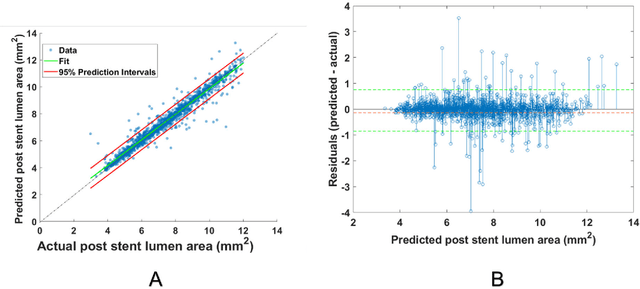
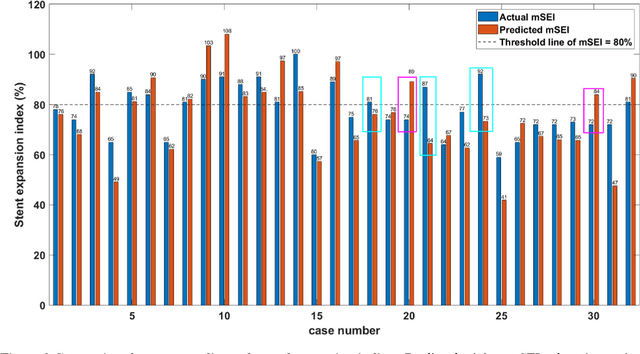
Abstract:BACKGROUND Careful evaluation of the risk of stent under-expansions before the intervention will aid treatment planning, including the application of a pre-stent plaque modification strategy. OBJECTIVES It remains challenging to achieve a proper stent expansion in the presence of severely calcified coronary lesions. Building on our work in deep learning segmentation, we created an automated machine learning approach that uses lesion attributes to predict stent under-expansion from pre-stent images, suggesting the need for plaque modification. METHODS Pre- and post-stent intravascular optical coherence tomography image data were obtained from 110 coronary lesions. Lumen and calcifications in pre-stent images were segmented using deep learning, and numerous features per lesion were extracted. We analyzed stent expansion along the lesion, enabling frame, segmental, and whole-lesion analyses. We trained regression models to predict the poststent lumen area and then to compute the stent expansion index (SEI). Stents with an SEI < or >/= 80% were classified as "under-expanded" and "well-expanded," respectively. RESULTS Best performance (root-mean-square-error = 0.04+/-0.02 mm2, r = 0.94+/-0.04, p < 0.0001) was achieved when we used features from both the lumen and calcification to train a Gaussian regression model for a segmental analysis over a segment length of 31 frames. Under-expansion classification results (AUC=0.85+/-0.02) were significantly improved over other approaches. CONCLUSIONS We used calcifications and lumen features to identify lesions at risk of stent under-expansion. Results suggest that the use of pre-stent images can inform physicians of the need to apply plaque modification approaches.
OCTOPUS -- optical coherence tomography plaque and stent analysis software
Apr 21, 2022


Abstract:Compared with other imaging modalities, intravascular optical coherence tomography (IVOCT) has significant advantages for guiding percutaneous coronary interventions. To aid IVOCT research studies, we developed the Optical Coherence TOmography PlaqUe and Stent (OCTOPUS) analysis software. To automate image analysis results, the software includes several important algorithmic steps: pre-processing, deep learning plaque segmentation, machine learning identification of stent struts, and registration of pullbacks. Interactive visualization and manual editing of segmentations were included in the software. Quantifications include stent deployment characteristics (e.g., stent strut malapposition), strut level analysis, calcium angle, and calcium thickness measurements. Interactive visualizations include (x,y) anatomical, en face, and longitudinal views with optional overlays. Underlying plaque segmentation algorithm yielded excellent pixel-wise results (86.2% sensitivity and 0.781 F1 score). Using OCTOPUS on 34 new pullbacks, we determined that following automated segmentation, only 13% and 23% of frames needed any manual touch up for detailed lumen and calcification labeling, respectively. Only up to 3.8% of plaque pixels were modified, leading to an average editing time of only 7.5 seconds/frame, an approximately 80% reduction compared to manual analysis. Regarding stent analysis, sensitivity and precision were both greater than 90%, and each strut was successfully classified as either covered or uncovered with high sensitivity (94%) and specificity (90%). We introduced and evaluated the clinical application of a highly automated software package, OCTOPUS, for quantitative plaque and stent analysis in IVOCT images. The software is currently used as an offline tool for research purposes; however, the software's embedded algorithms may also be useful for real-time treatment planning.
Automated analysis of fibrous cap in intravascular optical coherence tomography images of coronary arteries
Apr 21, 2022


Abstract:Thin-cap fibroatheroma (TCFA) and plaque rupture have been recognized as the most frequent risk factor for thrombosis and acute coronary syndrome. Intravascular optical coherence tomography (IVOCT) can identify TCFA and assess cap thickness, which provides an opportunity to assess plaque vulnerability. We developed an automated method that can detect lipidous plaque and assess fibrous cap thickness in IVOCT images. This study analyzed a total of 4,360 IVOCT image frames of 77 lesions among 41 patients. To improve segmentation performance, preprocessing included lumen segmentation, pixel-shifting, and noise filtering on the raw polar (r, theta) IVOCT images. We used the DeepLab-v3 plus deep learning model to classify lipidous plaque pixels. After lipid detection, we automatically detected the outer border of the fibrous cap using a special dynamic programming algorithm and assessed the cap thickness. Our method provided excellent discriminability of lipid plaque with a sensitivity of 85.8% and A-line Dice coefficient of 0.837. By comparing lipid angle measurements between two analysts following editing of our automated software, we found good agreement by Bland-Altman analysis (difference 6.7+/-17 degree; mean 196 degree). Our method accurately detected the fibrous cap from the detected lipid plaque. Automated analysis required a significant modification for only 5.5% frames. Furthermore, our method showed a good agreement of fibrous cap thickness between two analysts with Bland-Altman analysis (4.2+/-14.6 micron; mean 175 micron), indicating little bias between users and good reproducibility of the measurement. We developed a fully automated method for fibrous cap quantification in IVOCT images, resulting in good agreement with determinations by analysts. The method has great potential to enable highly automated, repeatable, and comprehensive evaluations of TCFAs.
 Add to Chrome
 Add to Firefox
 Add to Edge