Daren Wang
Dense ReLU Neural Networks for Temporal-spatial Model
Nov 15, 2024


Abstract:In this paper, we focus on fully connected deep neural networks utilizing the Rectified Linear Unit (ReLU) activation function for nonparametric estimation. We derive non-asymptotic bounds that lead to convergence rates, addressing both temporal and spatial dependence in the observed measurements. By accounting for dependencies across time and space, our models better reflect the complexities of real-world data, enhancing both predictive performance and theoretical robustness. We also tackle the curse of dimensionality by modeling the data on a manifold, exploring the intrinsic dimensionality of high-dimensional data. We broaden existing theoretical findings of temporal-spatial analysis by applying them to neural networks in more general contexts and demonstrate that our proof techniques are effective for models with short-range dependence. Our empirical simulations across various synthetic response functions underscore the superior performance of our method, outperforming established approaches in the existing literature. These findings provide valuable insights into the strong capabilities of dense neural networks for temporal-spatial modeling across a broad range of function classes.
Nonparametric Estimation via Variance-Reduced Sketching
Jan 22, 2024


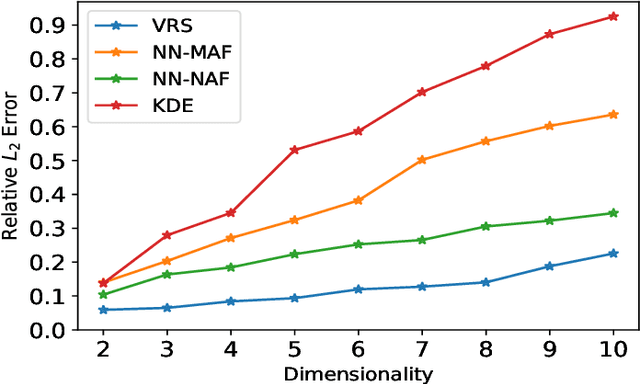
Abstract:Nonparametric models are of great interest in various scientific and engineering disciplines. Classical kernel methods, while numerically robust and statistically sound in low-dimensional settings, become inadequate in higher-dimensional settings due to the curse of dimensionality. In this paper, we introduce a new framework called Variance-Reduced Sketching (VRS), specifically designed to estimate density functions and nonparametric regression functions in higher dimensions with a reduced curse of dimensionality. Our framework conceptualizes multivariable functions as infinite-size matrices, and facilitates a new sketching technique motivated by numerical linear algebra literature to reduce the variance in estimation problems. We demonstrate the robust numerical performance of VRS through a series of simulated experiments and real-world data applications. Notably, VRS shows remarkable improvement over existing neural network estimators and classical kernel methods in numerous density estimation and nonparametric regression models. Additionally, we offer theoretical justifications for VRS to support its ability to deliver nonparametric estimation with a reduced curse of dimensionality.
Temporal-spatial model via Trend Filtering
Sep 13, 2023Abstract:This research focuses on the estimation of a non-parametric regression function designed for data with simultaneous time and space dependencies. In such a context, we study the Trend Filtering, a nonparametric estimator introduced by \cite{mammen1997locally} and \cite{rudin1992nonlinear}. For univariate settings, the signals we consider are assumed to have a kth weak derivative with bounded total variation, allowing for a general degree of smoothness. In the multivariate scenario, we study a $K$-Nearest Neighbor fused lasso estimator as in \cite{padilla2018adaptive}, employing an ADMM algorithm, suitable for signals with bounded variation that adhere to a piecewise Lipschitz continuity criterion. By aligning with lower bounds, the minimax optimality of our estimators is validated. A unique phase transition phenomenon, previously uncharted in Trend Filtering studies, emerges through our analysis. Both Simulation studies and real data applications underscore the superior performance of our method when compared with established techniques in the existing literature.
Optimal network online change point localisation
Jan 14, 2021


Abstract:We study the problem of online network change point detection. In this setting, a collection of independent Bernoulli networks is collected sequentially, and the underlying distributions change when a change point occurs. The goal is to detect the change point as quickly as possible, if it exists, subject to a constraint on the number or probability of false alarms. In this paper, on the detection delay, we establish a minimax lower bound and two upper bounds based on NP-hard algorithms and polynomial-time algorithms, i.e., \[ \mbox{detection delay} \begin{cases} \gtrsim \log(1/\alpha) \frac{\max\{r^2/n, \, 1\}}{\kappa_0^2 n \rho},\\ \lesssim \log(\Delta/\alpha) \frac{\max\{r^2/n, \, \log(r)\}}{\kappa_0^2 n \rho}, & \mbox{with NP-hard algorithms},\\ \lesssim \log(\Delta/\alpha) \frac{r}{\kappa_0^2 n \rho}, & \mbox{with polynomial-time algorithms}, \end{cases} \] where $\kappa_0, n, \rho, r$ and $\alpha$ are the normalised jump size, network size, entrywise sparsity, rank sparsity and the overall Type-I error upper bound. All the model parameters are allowed to vary as $\Delta$, the location of the change point, diverges. The polynomial-time algorithms are novel procedures that we propose in this paper, designed for quick detection under two different forms of Type-I error control. The first is based on controlling the overall probability of a false alarm when there are no change points, and the second is based on specifying a lower bound on the expected time of the first false alarm. Extensive experiments show that, under different scenarios and the aforementioned forms of Type-I error control, our proposed approaches outperform state-of-the-art methods.
Statistical Analysis of Persistence Intensity Functions
Oct 08, 2015


Abstract:Persistence diagrams are two-dimensional plots that summarize the topological features of functions and are an important part of topological data analysis. A problem that has received much attention is how deal with sets of persistence diagrams. How do we summarize them, average them or cluster them? One approach -- the persistence intensity function -- was introduced informally by Edelsbrunner, Ivanov, and Karasev (2012). Here we provide a modification and formalization of this approach. Using the persistence intensity function, we can visualize multiple diagrams, perform clustering and conduct two-sample tests.
 Add to Chrome
 Add to Firefox
 Add to Edge