Anusha Ramakrishnan
World Bank
Poverty Mapping Using Convolutional Neural Networks Trained on High and Medium Resolution Satellite Images, With an Application in Mexico
Nov 16, 2017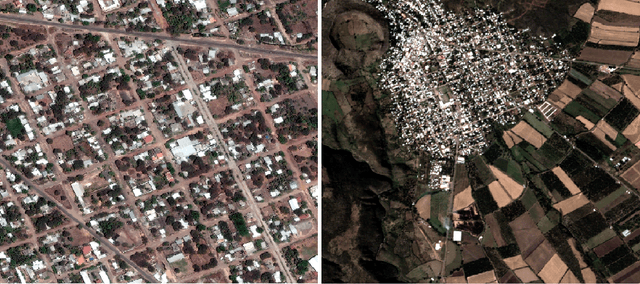
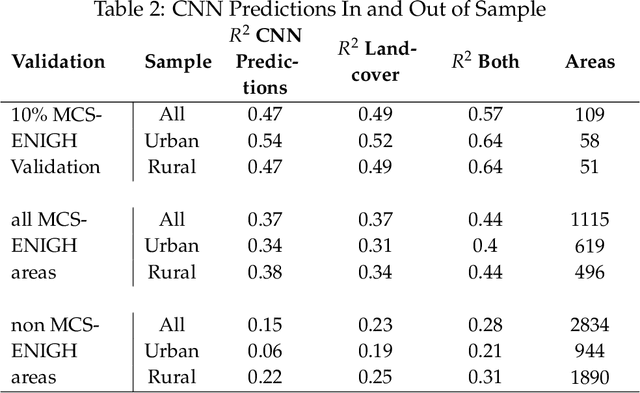
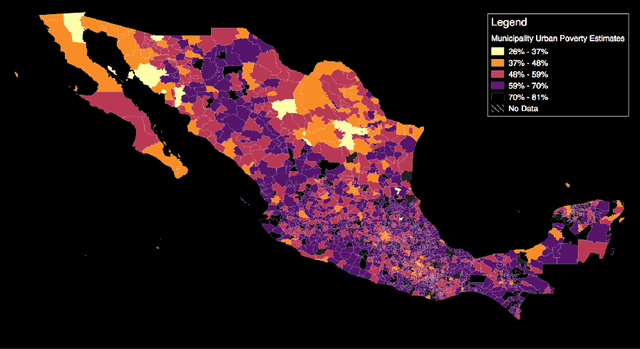
Abstract:Mapping the spatial distribution of poverty in developing countries remains an important and costly challenge. These "poverty maps" are key inputs for poverty targeting, public goods provision, political accountability, and impact evaluation, that are all the more important given the geographic dispersion of the remaining bottom billion severely poor individuals. In this paper we train Convolutional Neural Networks (CNNs) to estimate poverty directly from high and medium resolution satellite images. We use both Planet and Digital Globe imagery with spatial resolutions of 3-5 sq. m. and 50 sq. cm. respectively, covering all 2 million sq. km. of Mexico. Benchmark poverty estimates come from the 2014 MCS-ENIGH combined with the 2015 Intercensus and are used to estimate poverty rates for 2,456 Mexican municipalities. CNNs are trained using the 896 municipalities in the 2014 MCS-ENIGH. We experiment with several architectures (GoogleNet, VGG) and use GoogleNet as a final architecture where weights are fine-tuned from ImageNet. We find that 1) the best models, which incorporate satellite-estimated land use as a predictor, explain approximately 57% of the variation in poverty in a validation sample of 10 percent of MCS-ENIGH municipalities; 2) Across all MCS-ENIGH municipalities explanatory power reduces to 44% in a CNN prediction and landcover model; 3) Predicted poverty from the CNN predictions alone explains 47% of the variation in poverty in the validation sample, and 37% over all MCS-ENIGH municipalities; 4) In urban areas we see slight improvements from using Digital Globe versus Planet imagery, which explain 61% and 54% of poverty variation respectively. We conclude that CNNs can be trained end-to-end on satellite imagery to estimate poverty, although there is much work to be done to understand how the training process influences out of sample validation.
Multi-Sensor Prognostics using an Unsupervised Health Index based on LSTM Encoder-Decoder
Aug 22, 2016
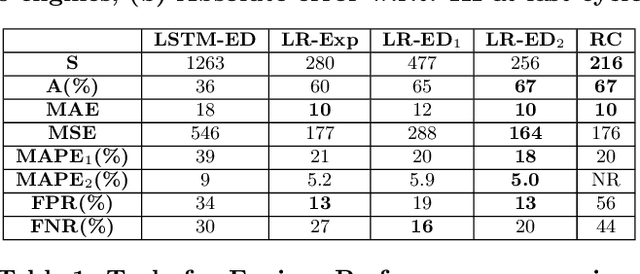
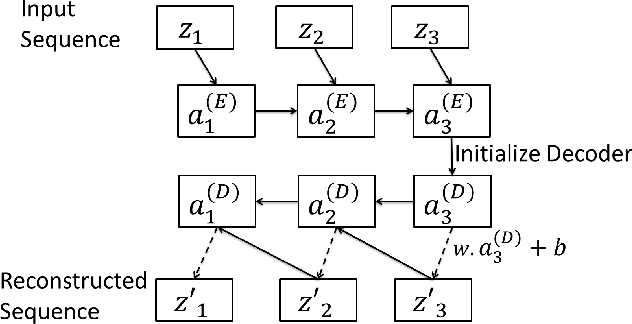

Abstract:Many approaches for estimation of Remaining Useful Life (RUL) of a machine, using its operational sensor data, make assumptions about how a system degrades or a fault evolves, e.g., exponential degradation. However, in many domains degradation may not follow a pattern. We propose a Long Short Term Memory based Encoder-Decoder (LSTM-ED) scheme to obtain an unsupervised health index (HI) for a system using multi-sensor time-series data. LSTM-ED is trained to reconstruct the time-series corresponding to healthy state of a system. The reconstruction error is used to compute HI which is then used for RUL estimation. We evaluate our approach on publicly available Turbofan Engine and Milling Machine datasets. We also present results on a real-world industry dataset from a pulverizer mill where we find significant correlation between LSTM-ED based HI and maintenance costs.
LSTM-based Encoder-Decoder for Multi-sensor Anomaly Detection
Jul 11, 2016

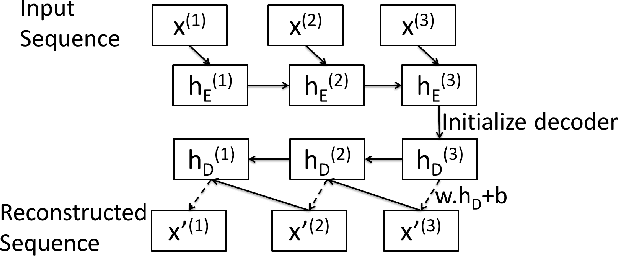
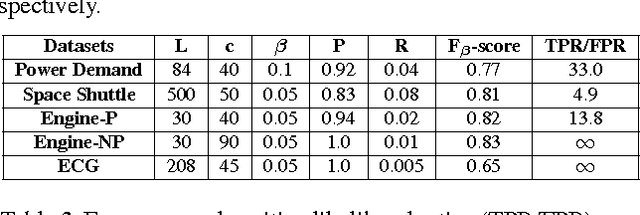
Abstract:Mechanical devices such as engines, vehicles, aircrafts, etc., are typically instrumented with numerous sensors to capture the behavior and health of the machine. However, there are often external factors or variables which are not captured by sensors leading to time-series which are inherently unpredictable. For instance, manual controls and/or unmonitored environmental conditions or load may lead to inherently unpredictable time-series. Detecting anomalies in such scenarios becomes challenging using standard approaches based on mathematical models that rely on stationarity, or prediction models that utilize prediction errors to detect anomalies. We propose a Long Short Term Memory Networks based Encoder-Decoder scheme for Anomaly Detection (EncDec-AD) that learns to reconstruct 'normal' time-series behavior, and thereafter uses reconstruction error to detect anomalies. We experiment with three publicly available quasi predictable time-series datasets: power demand, space shuttle, and ECG, and two real-world engine datasets with both predictive and unpredictable behavior. We show that EncDec-AD is robust and can detect anomalies from predictable, unpredictable, periodic, aperiodic, and quasi-periodic time-series. Further, we show that EncDec-AD is able to detect anomalies from short time-series (length as small as 30) as well as long time-series (length as large as 500).
 Add to Chrome
 Add to Firefox
 Add to Edge