Jonathan Hersh
Chapman University
A Topic Modeling Approach to Classifying Open Street Map Health Clinics and Schools in Sub-Saharan Africa
Dec 22, 2022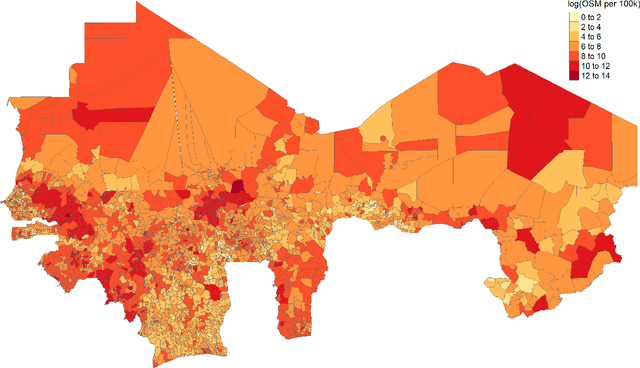
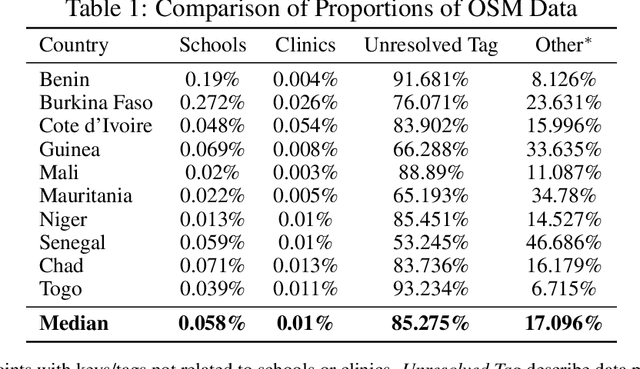
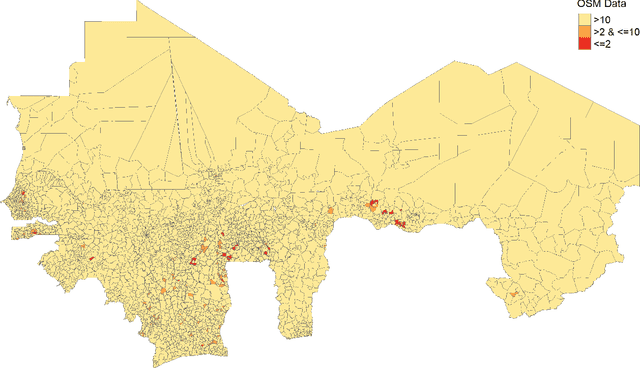
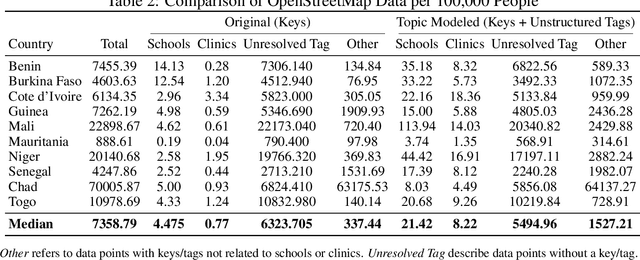
Abstract:Data deprivation, or the lack of easily available and actionable information on the well-being of individuals, is a significant challenge for the developing world and an impediment to the design and operationalization of policies intended to alleviate poverty. In this paper we explore the suitability of data derived from OpenStreetMap to proxy for the location of two crucial public services: schools and health clinics. Thanks to the efforts of thousands of digital humanitarians, online mapping repositories such as OpenStreetMap contain millions of records on buildings and other structures, delineating both their location and often their use. Unfortunately much of this data is locked in complex, unstructured text rendering it seemingly unsuitable for classifying schools or clinics. We apply a scalable, unsupervised learning method to unlabeled OpenStreetMap building data to extract the location of schools and health clinics in ten countries in Africa. We find the topic modeling approach greatly improves performance versus reliance on structured keys alone. We validate our results by comparing schools and clinics identified by our OSM method versus those identified by the WHO, and describe OSM coverage gaps more broadly.
Monitoring War Destruction from Space: A Machine Learning Approach
Oct 14, 2020


Abstract:Existing data on building destruction in conflict zones rely on eyewitness reports or manual detection, which makes it generally scarce, incomplete and potentially biased. This lack of reliable data imposes severe limitations for media reporting, humanitarian relief efforts, human rights monitoring, reconstruction initiatives, and academic studies of violent conflict. This article introduces an automated method of measuring destruction in high-resolution satellite images using deep learning techniques combined with data augmentation to expand training samples. We apply this method to the Syrian civil war and reconstruct the evolution of damage in major cities across the country. The approach allows generating destruction data with unprecedented scope, resolution, and frequency - only limited by the available satellite imagery - which can alleviate data limitations decisively.
Poverty Mapping Using Convolutional Neural Networks Trained on High and Medium Resolution Satellite Images, With an Application in Mexico
Nov 16, 2017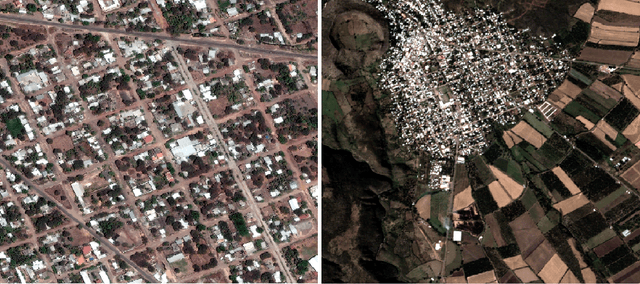
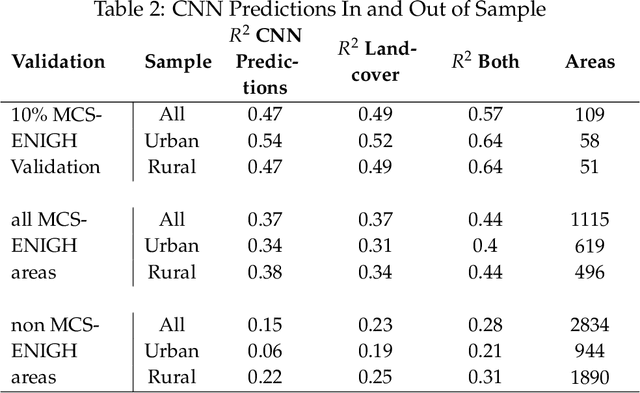
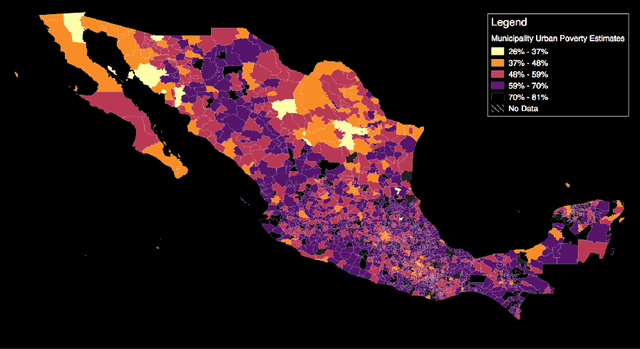
Abstract:Mapping the spatial distribution of poverty in developing countries remains an important and costly challenge. These "poverty maps" are key inputs for poverty targeting, public goods provision, political accountability, and impact evaluation, that are all the more important given the geographic dispersion of the remaining bottom billion severely poor individuals. In this paper we train Convolutional Neural Networks (CNNs) to estimate poverty directly from high and medium resolution satellite images. We use both Planet and Digital Globe imagery with spatial resolutions of 3-5 sq. m. and 50 sq. cm. respectively, covering all 2 million sq. km. of Mexico. Benchmark poverty estimates come from the 2014 MCS-ENIGH combined with the 2015 Intercensus and are used to estimate poverty rates for 2,456 Mexican municipalities. CNNs are trained using the 896 municipalities in the 2014 MCS-ENIGH. We experiment with several architectures (GoogleNet, VGG) and use GoogleNet as a final architecture where weights are fine-tuned from ImageNet. We find that 1) the best models, which incorporate satellite-estimated land use as a predictor, explain approximately 57% of the variation in poverty in a validation sample of 10 percent of MCS-ENIGH municipalities; 2) Across all MCS-ENIGH municipalities explanatory power reduces to 44% in a CNN prediction and landcover model; 3) Predicted poverty from the CNN predictions alone explains 47% of the variation in poverty in the validation sample, and 37% over all MCS-ENIGH municipalities; 4) In urban areas we see slight improvements from using Digital Globe versus Planet imagery, which explain 61% and 54% of poverty variation respectively. We conclude that CNNs can be trained end-to-end on satellite imagery to estimate poverty, although there is much work to be done to understand how the training process influences out of sample validation.
 Add to Chrome
 Add to Firefox
 Add to Edge