Andreas Henelius
Estimating regression errors without ground truth values
Oct 09, 2019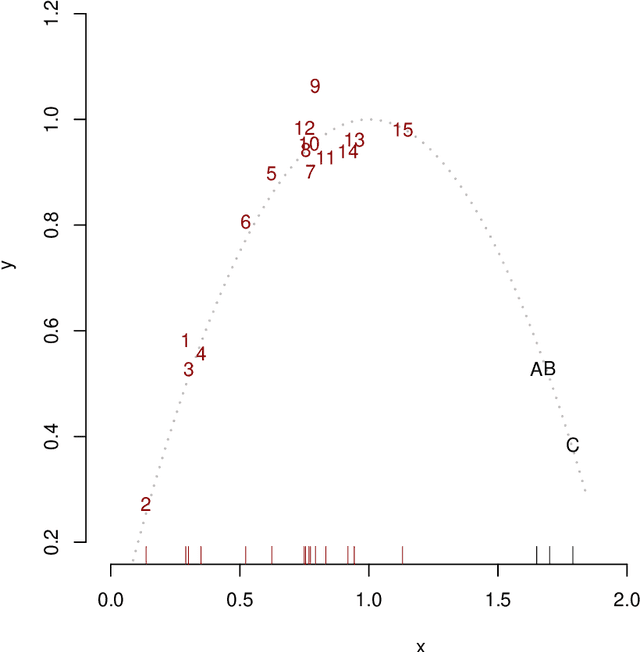
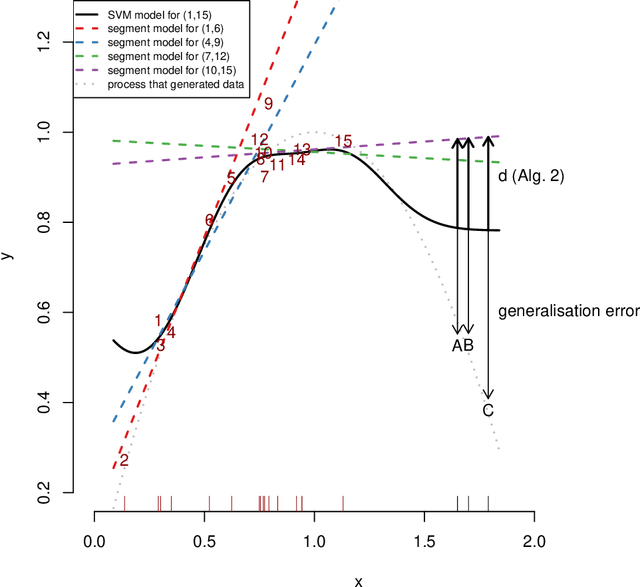
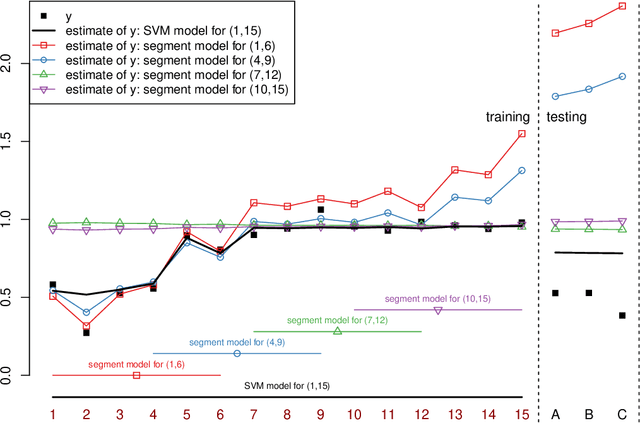

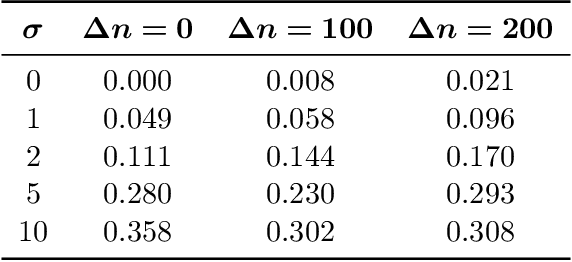
Abstract:Regression analysis is a standard supervised machine learning method used to model an outcome variable in terms of a set of predictor variables. In most real-world applications we do not know the true value of the outcome variable being predicted outside the training data, i.e., the ground truth is unknown. It is hence not straightforward to directly observe when the estimate from a model potentially is wrong, due to phenomena such as overfitting and concept drift. In this paper we present an efficient framework for estimating the generalization error of regression functions, applicable to any family of regression functions when the ground truth is unknown. We present a theoretical derivation of the framework and empirically evaluate its strengths and limitations. We find that it performs robustly and is useful for detecting concept drift in datasets in several real-world domains.
Guided Visual Exploration of Relations in Data Sets
May 07, 2019
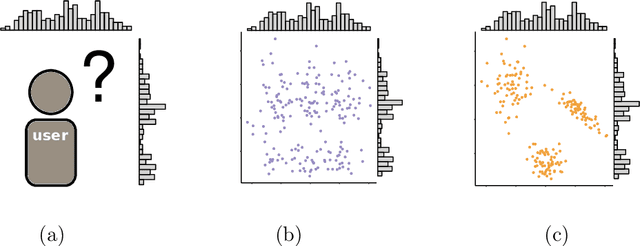
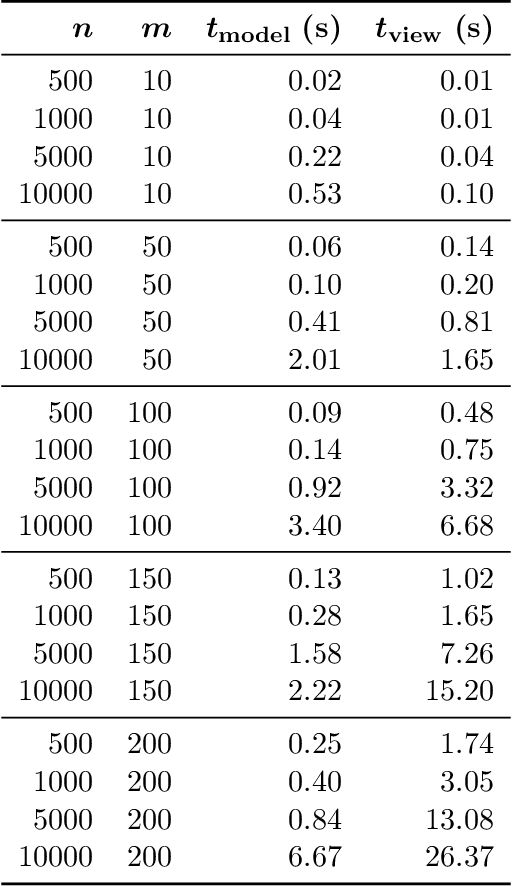
Abstract:Efficient explorative data analysis systems must take into account both what a user knows and wants to know. This paper proposes a principled framework for interactive visual exploration of relations in data, through views most informative given the user's current knowledge and objectives. The user can input pre-existing knowledge of relations in the data and also formulate specific exploration interests, then taken into account in the exploration. The idea is to steer the exploration process towards the interests of the user, instead of showing uninteresting or already known relations. The user's knowledge is modelled by a distribution over data sets parametrised by subsets of rows and columns of data, called tile constraints. We provide a computationally efficient implementation of this concept based on constrained randomisation. Furthermore, we describe a novel dimensionality reduction method for finding the views most informative to the user, which at the limit of no background knowledge and with generic objectives reduces to PCA. We show that the method is suitable for interactive use and robust to noise, outperforms standard projection pursuit visualisation methods, and gives understandable and useful results in analysis of real-world data. We have released an open-source implementation of the framework.
Human-guided data exploration using randomisation
May 20, 2018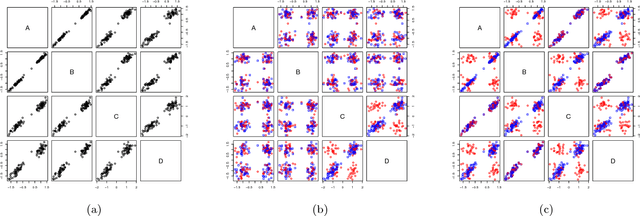
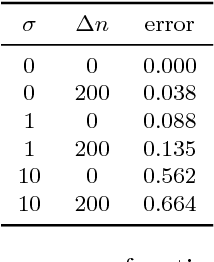
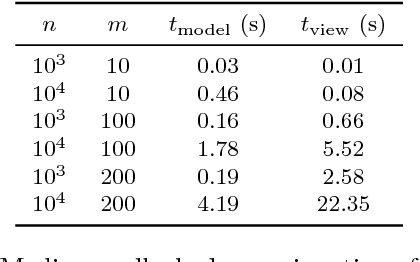
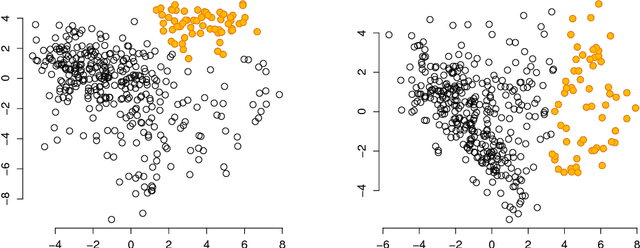
Abstract:An explorative data analysis system should be aware of what the user already knows and what the user wants to know of the data: otherwise the system cannot provide the user with the most informative and useful views of the data. We propose a principled way to do explorative data analysis, where the user's background knowledge is modeled by a distribution parametrised by subsets of rows and columns in the data, called tiles. The user can also use tiles to describe his or her interests concerning relations in the data. We provide a computationally efficient implementation of this concept based on constrained randomisation. This is used to model both the background knowledge and the user's information request and is a necessary prerequisite for any interactive system. Furthermore, we describe a novel linear projection pursuit method to find and show the views most informative to the user, which at the limit of no background knowledge and with generic objective reduces to PCA. We show that our method is robust under noise and fast enough for interactive use. We also show that the method gives understandable and useful results when analysing real-world data sets. We will release, under an open source license, a software library implementing the idea, including the experiments presented in this paper. We show that our method can outperform standard projection pursuit visualisation methods in exploration tasks. Our framework makes it possible to construct human-guided data exploration systems which are fast, powerful, and give results that are easy to comprehend.
Human-Guided Data Exploration
Apr 09, 2018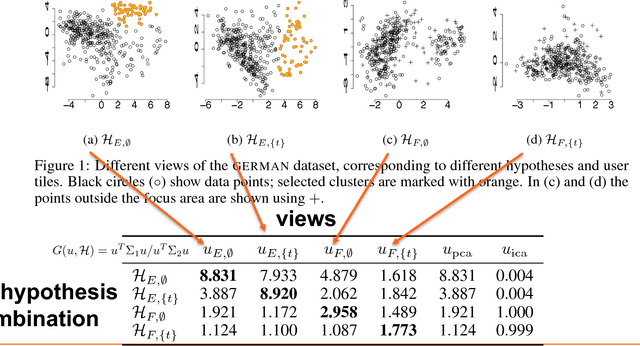
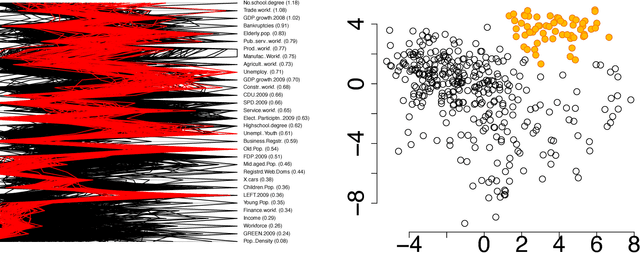
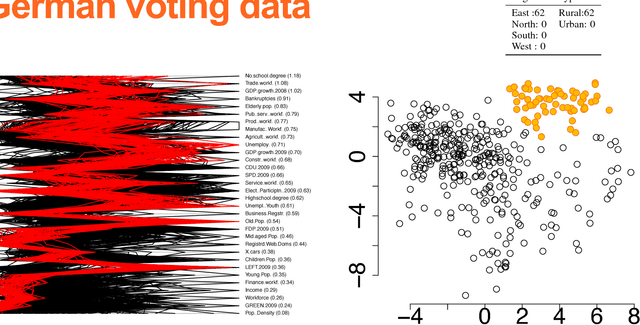
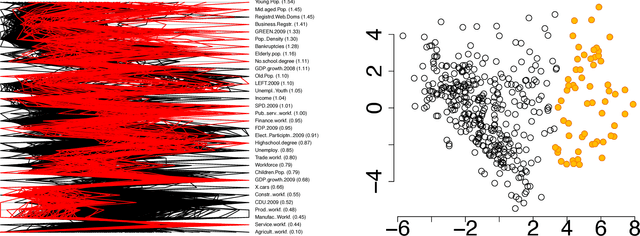
Abstract:The outcome of the explorative data analysis (EDA) phase is vital for successful data analysis. EDA is more effective when the user interacts with the system used to carry out the exploration. In the recently proposed paradigm of iterative data mining the user controls the exploration by inputting knowledge in the form of patterns observed during the process. The system then shows the user views of the data that are maximally informative given the user's current knowledge. Although this scheme is good at showing surprising views of the data to the user, there is a clear shortcoming: the user cannot steer the process. In many real cases we want to focus on investigating specific questions concerning the data. This paper presents the Human Guided Data Exploration framework, generalising previous research. This framework allows the user to incorporate existing knowledge into the exploration process, focus on exploring a subset of the data, and compare different complex hypotheses concerning relations in the data. The framework utilises a computationally efficient constrained randomisation scheme. To showcase the framework, we developed a free open-source tool, using which the empirical evaluation on real-world datasets was carried out. Our evaluation shows that the ability to focus on particular subsets and being able to compare hypotheses are important additions to the interactive iterative data mining process.
Interpreting Classifiers through Attribute Interactions in Datasets
Jul 24, 2017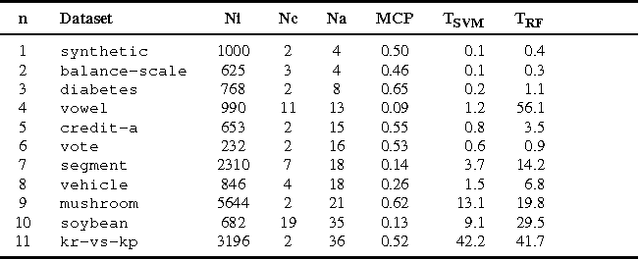
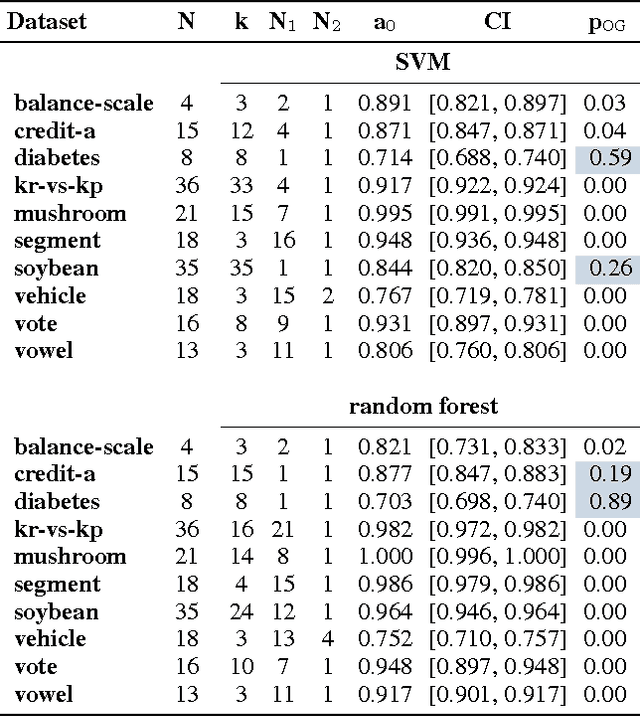
Abstract:In this work we present the novel ASTRID method for investigating which attribute interactions classifiers exploit when making predictions. Attribute interactions in classification tasks mean that two or more attributes together provide stronger evidence for a particular class label. Knowledge of such interactions makes models more interpretable by revealing associations between attributes. This has applications, e.g., in pharmacovigilance to identify interactions between drugs or in bioinformatics to investigate associations between single nucleotide polymorphisms. We also show how the found attribute partitioning is related to a factorisation of the data generating distribution and empirically demonstrate the utility of the proposed method.
Finding Statistically Significant Attribute Interactions
Mar 16, 2017
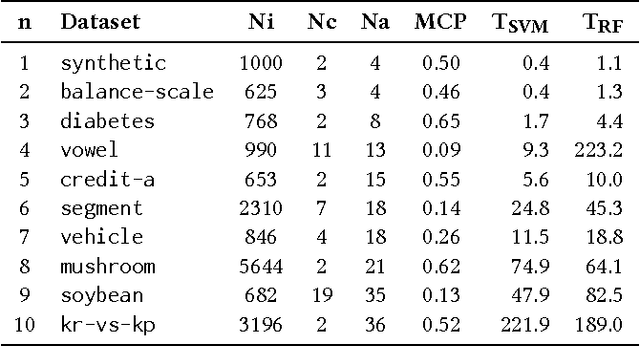
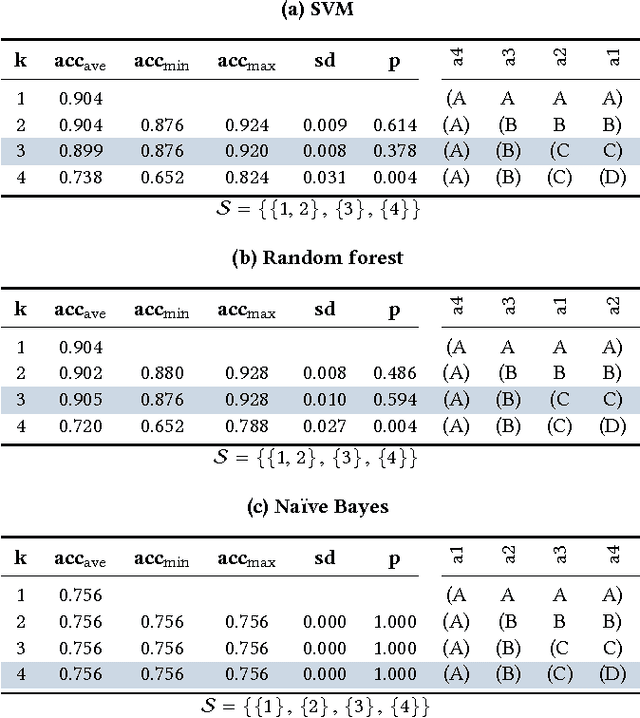
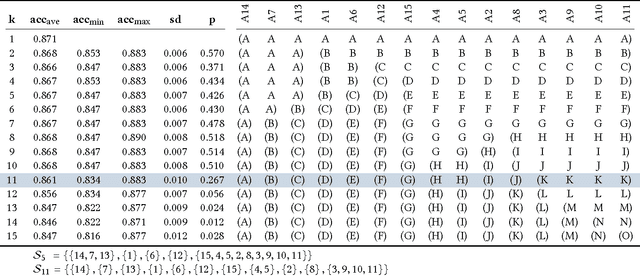
Abstract:In many data exploration tasks it is meaningful to identify groups of attribute interactions that are specific to a variable of interest. For instance, in a dataset where the attributes are medical markers and the variable of interest (class variable) is binary indicating presence/absence of disease, we would like to know which medical markers interact with respect to the binary class label. These interactions are useful in several practical applications, for example, to gain insight into the structure of the data, in feature selection, and in data anonymisation. We present a novel method, based on statistical significance testing, that can be used to verify if the data set has been created by a given factorised class-conditional joint distribution, where the distribution is parametrised by a partition of its attributes. Furthermore, we provide a method, named ASTRID, for automatically finding a partition of attributes describing the distribution that has generated the data. State-of-the-art classifiers are utilised to capture the interactions present in the data by systematically breaking attribute interactions and observing the effect of this breaking on classifier performance. We empirically demonstrate the utility of the proposed method with examples using real and synthetic data.
Clustering with Confidence: Finding Clusters with Statistical Guarantees
Dec 30, 2016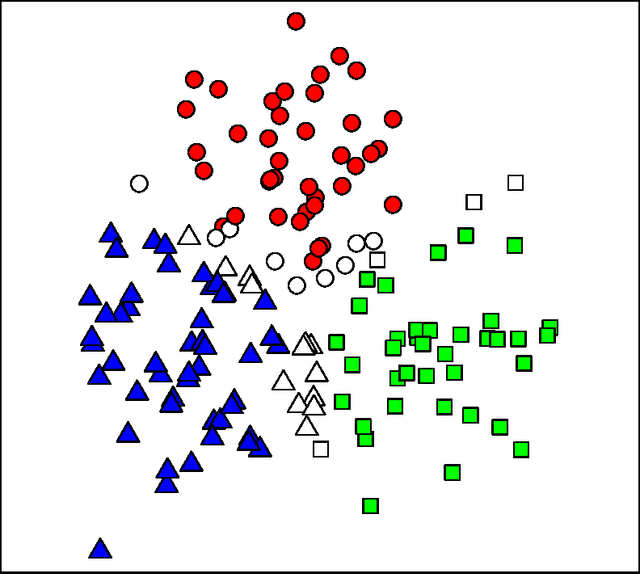
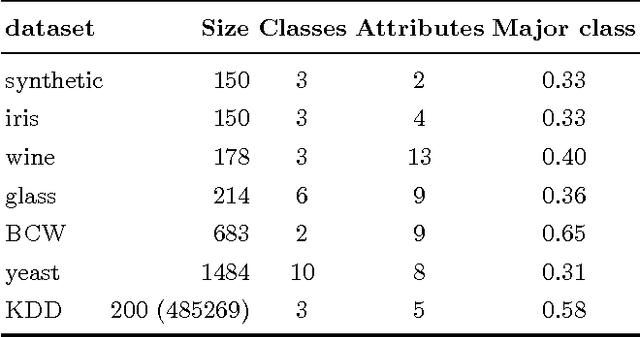
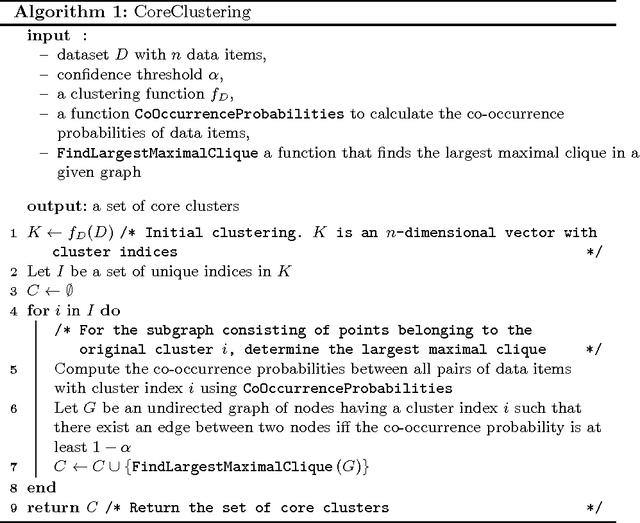
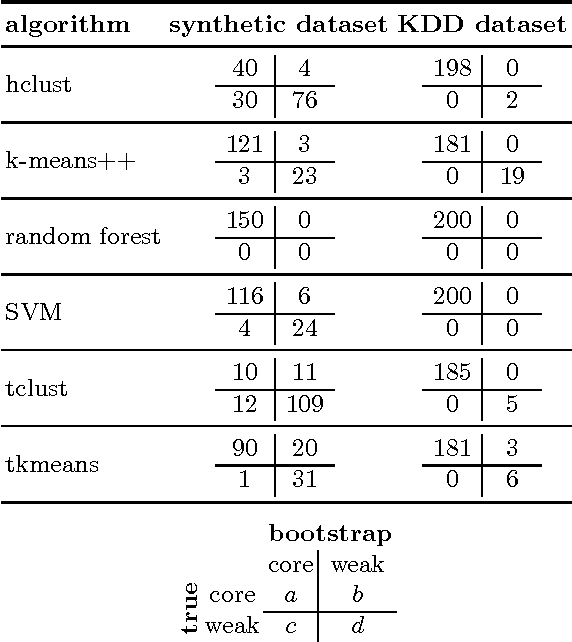
Abstract:Clustering is a widely used unsupervised learning method for finding structure in the data. However, the resulting clusters are typically presented without any guarantees on their robustness; slightly changing the used data sample or re-running a clustering algorithm involving some stochastic component may lead to completely different clusters. There is, hence, a need for techniques that can quantify the instability of the generated clusters. In this study, we propose a technique for quantifying the instability of a clustering solution and for finding robust clusters, termed core clusters, which correspond to clusters where the co-occurrence probability of each data item within a cluster is at least $1 - \alpha$. We demonstrate how solving the core clustering problem is linked to finding the largest maximal cliques in a graph. We show that the method can be used with both clustering and classification algorithms. The proposed method is tested on both simulated and real datasets. The results show that the obtained clusters indeed meet the guarantees on robustness.
 Add to Chrome
 Add to Firefox
 Add to Edge