Abhishek Varghese
QEDCartographer: Automating Formal Verification Using Reward-Free Reinforcement Learning
Aug 17, 2024


Abstract:Formal verification is a promising method for producing reliable software, but the difficulty of manually writing verification proofs severely limits its utility in practice. Recent methods have automated some proof synthesis by guiding a search through the proof space using a theorem prover. Unfortunately, the theorem prover provides only the crudest estimate of progress, resulting in effectively undirected search. To address this problem, we create QEDCartographer, an automated proof-synthesis tool that combines supervised and reinforcement learning to more effectively explore the proof space. QEDCartographer incorporates the proofs' branching structure, enabling reward-free search and overcoming the sparse reward problem inherent to formal verification. We evaluate QEDCartographer using the CoqGym benchmark of 68.5K theorems from 124 open-source Coq projects. QEDCartographer fully automatically proves 21.4% of the test-set theorems. Previous search-based proof-synthesis tools Tok, Tac, ASTactic, Passport, and Proverbot9001, which rely only on supervised learning, prove 9.6%, 9.8%, 10.9%, 12.5%, and 19.8%, respectively. Diva, which combines 62 tools, proves 19.2%. Comparing to the most effective prior tool, Proverbot9001, QEDCartographer produces 26% shorter proofs 27% faster, on average over the theorems both tools prove. Together, QEDCartographer and non-learning-based CoqHammer prove 31.8% of the theorems, while CoqHammer alone proves 26.6%. Our work demonstrates that reinforcement learning is a fruitful research direction for improving proof-synthesis tools' search mechanisms.
On the intrinsic dimensionality of Covid-19 data: a global perspective
Mar 08, 2022


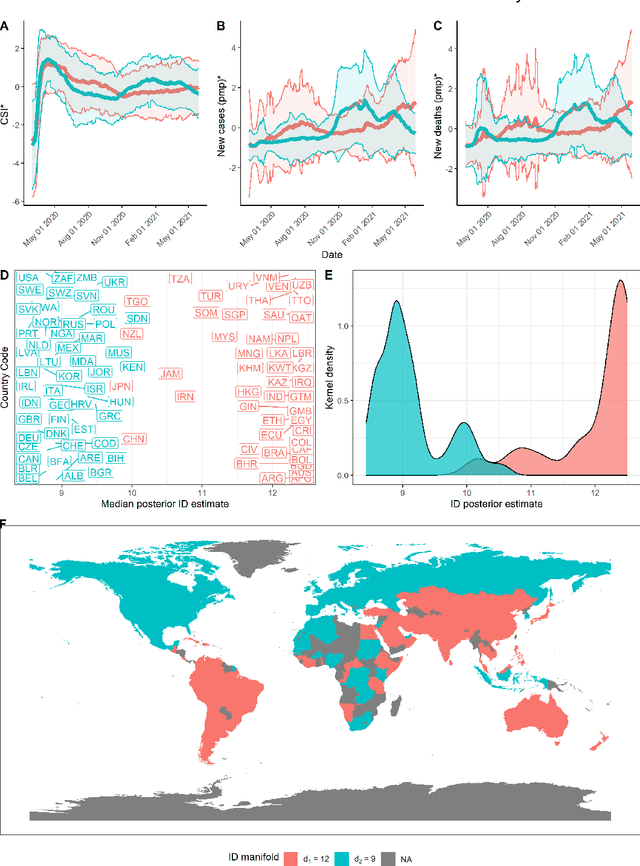
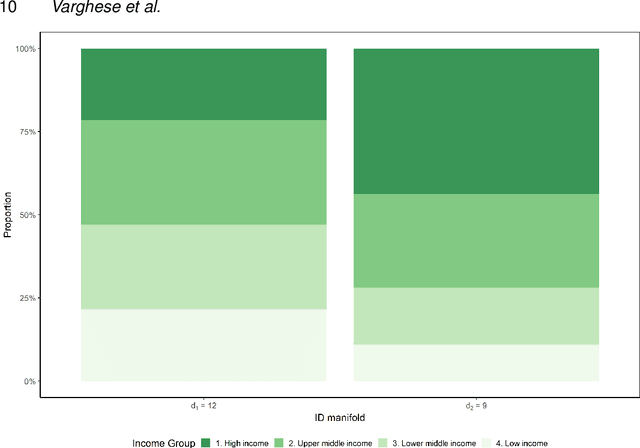
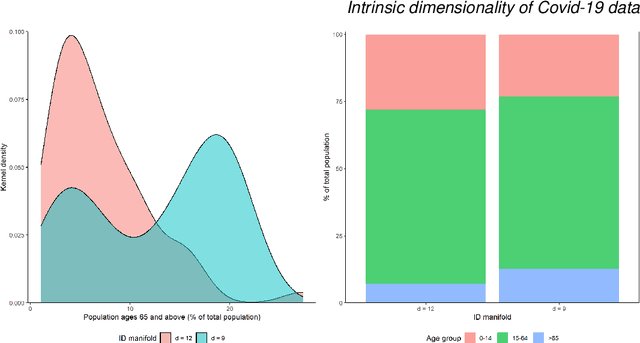
Abstract:This paper aims to develop a global perspective of the complexity of the relationship between the standardised per-capita growth rate of Covid-19 cases, deaths, and the OxCGRT Covid-19 Stringency Index, a measure describing a country's stringency of lockdown policies. To achieve our goal, we use a heterogeneous intrinsic dimension estimator implemented as a Bayesian mixture model, called Hidalgo. We identify that the Covid-19 dataset may project onto two low-dimensional manifolds without significant information loss. The low dimensionality suggests strong dependency among the standardised growth rates of cases and deaths per capita and the OxCGRT Covid-19 Stringency Index for a country over 2020-2021. Given the low dimensional structure, it may be feasible to model observable Covid-19 dynamics with few parameters. Importantly, we identify spatial autocorrelation in the intrinsic dimension distribution worldwide. Moreover, we highlight that high-income countries are more likely to lie on low-dimensional manifolds, likely arising from aging populations, comorbidities, and increased per capita mortality burden from Covid-19. Finally, we temporally stratify the dataset to examine the intrinsic dimension at a more granular level throughout the Covid-19 pandemic.
 Add to Chrome
 Add to Firefox
 Add to Edge