Scene Graphs: A Survey of Generations and Applications
Paper and Code
Mar 17, 2021


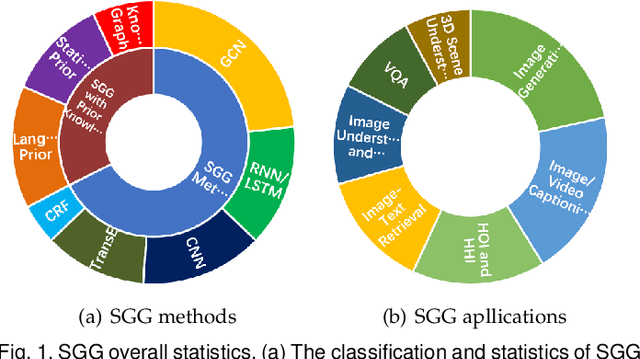
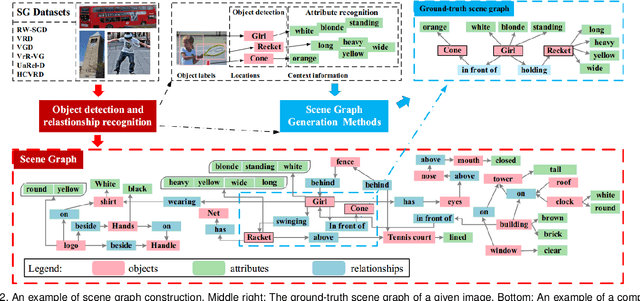
Scene graph is a structured representation of a scene that can clearly express the objects, attributes, and relationships between objects in the scene. As computer vision technology continues to develop, people are no longer satisfied with simply detecting and recognizing objects in images; instead, people look forward to a higher level of understanding and reasoning about visual scenes. For example, given an image, we want to not only detect and recognize objects in the image, but also know the relationship between objects (visual relationship detection), and generate a text description (image captioning) based on the image content. Alternatively, we might want the machine to tell us what the little girl in the image is doing (Visual Question Answering (VQA)), or even remove the dog from the image and find similar images (image editing and retrieval), etc. These tasks require a higher level of understanding and reasoning for image vision tasks. The scene graph is just such a powerful tool for scene understanding. Therefore, scene graphs have attracted the attention of a large number of researchers, and related research is often cross-modal, complex, and rapidly developing. However, no relatively systematic survey of scene graphs exists at present. To this end, this survey conducts a comprehensive investigation of the current scene graph research. More specifically, we first summarized the general definition of the scene graph, then conducted a comprehensive and systematic discussion on the generation method of the scene graph (SGG) and the SGG with the aid of prior knowledge. We then investigated the main applications of scene graphs and summarized the most commonly used datasets. Finally, we provide some insights into the future development of scene graphs. We believe this will be a very helpful foundation for future research on scene graphs.
 Add to Chrome
 Add to Firefox
 Add to Edge