Umar Islambekov
TDAvec: Computing Vector Summaries of Persistence Diagrams for Topological Data Analysis in R and Python
Nov 26, 2024Abstract:Persistent homology is a widely-used tool in topological data analysis (TDA) for understanding the underlying shape of complex data. By constructing a filtration of simplicial complexes from data points, it captures topological features such as connected components, loops, and voids across multiple scales. These features are encoded in persistence diagrams (PDs), which provide a concise summary of the data's topological structure. However, the non-Hilbert nature of the space of PDs poses challenges for their direct use in machine learning applications. To address this, kernel methods and vectorization techniques have been developed to transform PDs into machine-learning-compatible formats. In this paper, we introduce a new software package designed to streamline the vectorization of PDs, offering an intuitive workflow and advanced functionalities. We demonstrate the necessity of the package through practical examples and provide a detailed discussion on its contributions to applied TDA. Definitions of all vectorization summaries used in the package are included in the appendix.
Explaining the Power of Topological Data Analysis in Graph Machine Learning
Jan 08, 2024Abstract:Topological Data Analysis (TDA) has been praised by researchers for its ability to capture intricate shapes and structures within data. TDA is considered robust in handling noisy and high-dimensional datasets, and its interpretability is believed to promote an intuitive understanding of model behavior. However, claims regarding the power and usefulness of TDA have only been partially tested in application domains where TDA-based models are compared to other graph machine learning approaches, such as graph neural networks. We meticulously test claims on TDA through a comprehensive set of experiments and validate their merits. Our results affirm TDA's robustness against outliers and its interpretability, aligning with proponents' arguments. However, we find that TDA does not significantly enhance the predictive power of existing methods in our specific experiments, while incurring significant computational costs. We investigate phenomena related to graph characteristics, such as small diameters and high clustering coefficients, to mitigate the computational expenses of TDA computations. Our results offer valuable perspectives on integrating TDA into graph machine learning tasks.
Vector Summaries of Persistence Diagrams for Permutation-based Hypothesis Testing
Jun 09, 2023
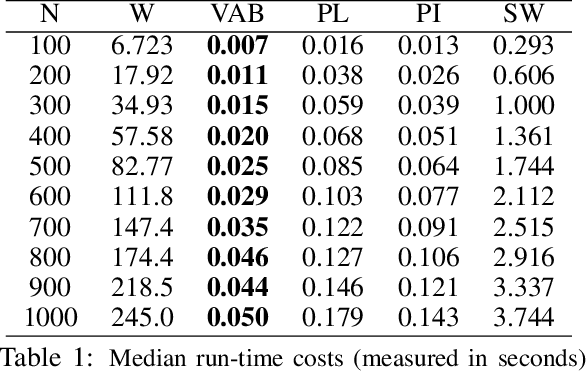
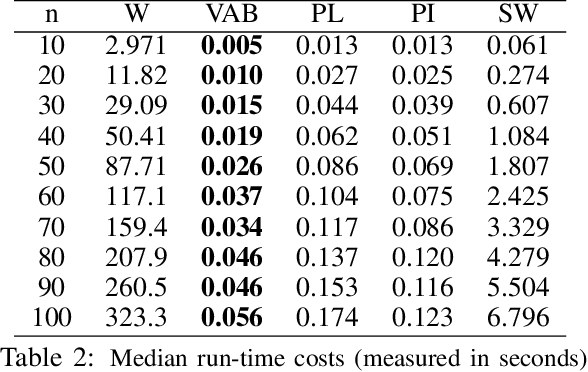
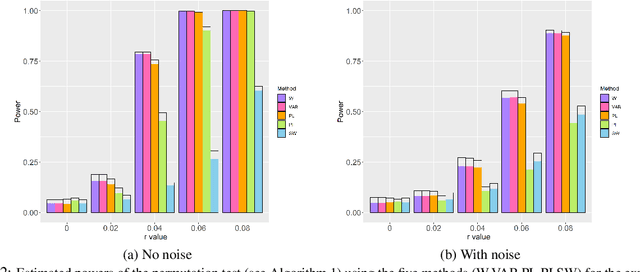
Abstract:Over the past decade, the techniques of topological data analysis (TDA) have grown into prominence to describe the shape of data. In recent years, there has been increasing interest in developing statistical methods and in particular hypothesis testing procedures for TDA. Under the statistical perspective, persistence diagrams -- the central multi-scale topological descriptors of data provided by TDA -- are viewed as random observations sampled from some population or process. In this context, one of the earliest works on hypothesis testing focuses on the two-group permutation-based approach where the associated loss function is defined in terms of within-group pairwise bottleneck or Wasserstein distances between persistence diagrams (Robinson and Turner, 2017). However, in situations where persistence diagrams are large in size and number, the permutation test in question gets computationally more costly to apply. To address this limitation, we instead consider pairwise distances between vectorized functional summaries of persistence diagrams for the loss function. In the present work, we explore the utility of the Betti function in this regard, which is one of the simplest function summaries of persistence diagrams. We introduce an alternative vectorization method for the Betti function based on integration and prove stability results with respect to the Wasserstein distance. Moreover, we propose a new shuffling technique of group labels to increase the power of the test. Through several experimental studies, on both synthetic and real data, we show that the vectorized Betti function leads to competitive results compared to the baseline method involving the Wasserstein distances for the permutation test.
A fast topological approach for predicting anomalies in time-varying graphs
May 11, 2023Abstract:Large time-varying graphs are increasingly common in financial, social and biological settings. Feature extraction that efficiently encodes the complex structure of sparse, multi-layered, dynamic graphs presents computational and methodological challenges. In the past decade, a persistence diagram (PD) from topological data analysis (TDA) has become a popular descriptor of shape of data with a well-defined distance between points. However, applications of TDA to graphs, where there is no intrinsic concept of distance between the nodes, remain largely unexplored. This paper addresses this gap in the literature by introducing a computationally efficient framework to extract shape information from graph data. Our framework has two main steps: first, we compute a PD using the so-called lower-star filtration which utilizes quantitative node attributes, and then vectorize it by averaging the associated Betti function over successive scale values on a one-dimensional grid. Our approach avoids embedding a graph into a metric space and has stability properties against input noise. In simulation studies, we show that the proposed vector summary leads to improved change point detection rate in time-varying graphs. In a real data application, our approach provides up to 22% gain in anomalous price prediction for the Ethereum cryptocurrency transaction networks.
A computationally efficient framework for vector representation of persistence diagrams
Sep 16, 2021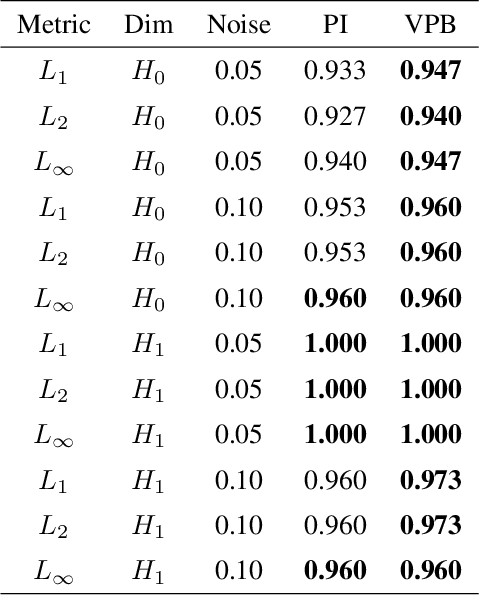

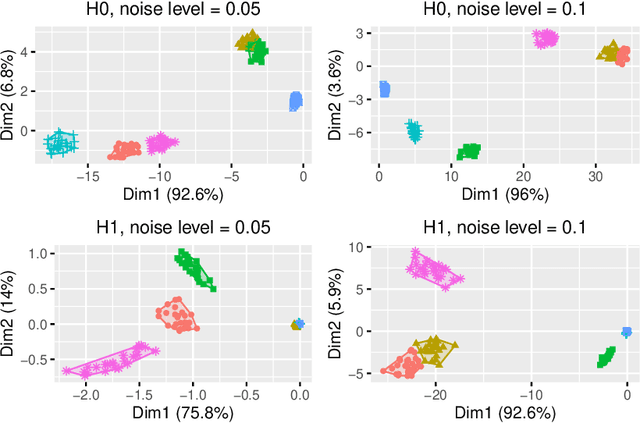

Abstract:In Topological Data Analysis, a common way of quantifying the shape of data is to use a persistence diagram (PD). PDs are multisets of points in $\mathbb{R}^2$ computed using tools of algebraic topology. However, this multi-set structure limits the utility of PDs in applications. Therefore, in recent years efforts have been directed towards extracting informative and efficient summaries from PDs to broaden the scope of their use for machine learning tasks. We propose a computationally efficient framework to convert a PD into a vector in $\mathbb{R}^n$, called a vectorized persistence block (VPB). We show that our representation possesses many of the desired properties of vector-based summaries such as stability with respect to input noise, low computational cost and flexibility. Through simulation studies, we demonstrate the effectiveness of VPBs in terms of performance and computational cost within various learning tasks, namely clustering, classification and change point detection.
Dissecting Ethereum Blockchain Analytics: What We Learn from Topology and Geometry of Ethereum Graph
Dec 20, 2019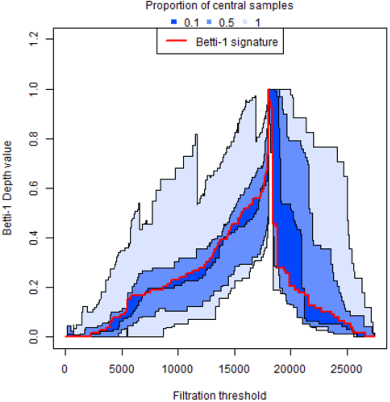
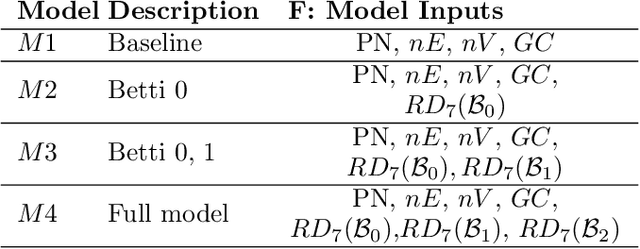
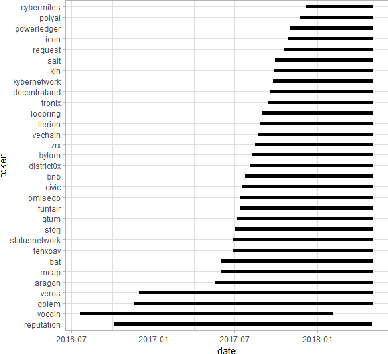
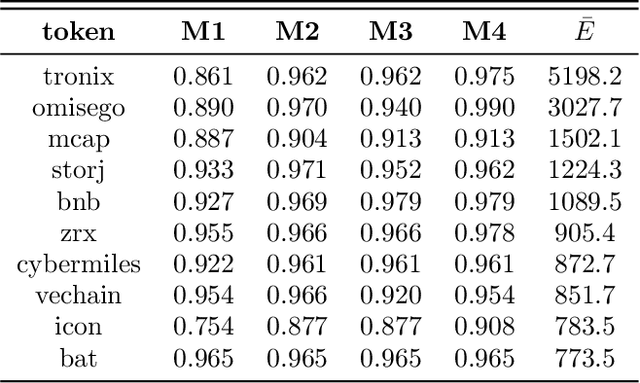
Abstract:Blockchain technology and, in particular, blockchain-based cryptocurrencies offer us information that has never been seen before in the financial world. In contrast to fiat currencies, all transactions of crypto-currencies and crypto-tokens are permanently recorded on distributed ledgers and are publicly available. As a result, this allows us to construct a transaction graph and to assess not only its organization but to glean relationships between transaction graph properties and crypto price dynamics. The ultimate goal of this paper is to facilitate our understanding on horizons and limitations of what can be learned on crypto-tokens from local topology and geometry of the Ethereum transaction network whose even global network properties remain scarcely explored. By introducing novel tools based on topological data analysis and functional data depth into Blockchain Data Analytics, we show that Ethereum network (one of the most popular blockchains for creating new crypto-tokens) can provide critical insights on price strikes of crypto-tokens that are otherwise largely inaccessible with conventional data sources and traditional analytic methods.
Harnessing the power of Topological Data Analysis to detect change points in time series
Oct 28, 2019


Abstract:We introduce a novel geometry-oriented methodology, based on the emerging tools of topological data analysis, into the change point detection framework. The key rationale is that change points are likely to be associated with changes in geometry behind the data generating process. While the applications of topological data analysis to change point detection are potentially very broad, in this paper we primarily focus on integrating topological concepts with the existing nonparametric methods for change point detection. In particular, the proposed new geometry-oriented approach aims to enhance detection accuracy of distributional regime shift locations. Our simulation studies suggest that integration of topological data analysis with some existing algorithms for change point detection leads to consistently more accurate detection results. We illustrate our new methodology in application to the two closely related environmental time series datasets -ice phenology of the Lake Baikal and the North Atlantic Oscillation indices, in a research query for a possible association between their estimated regime shift locations.
Unsupervised Space-Time Clustering using Persistent Homology
Oct 25, 2019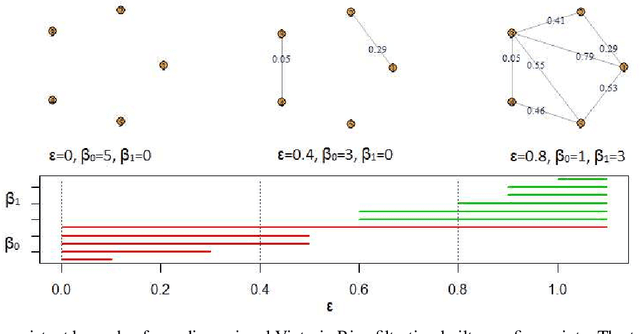
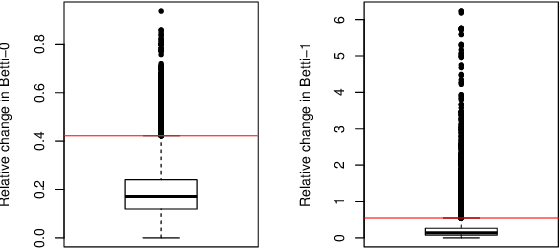
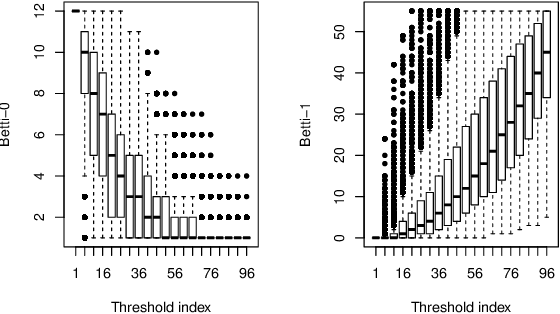
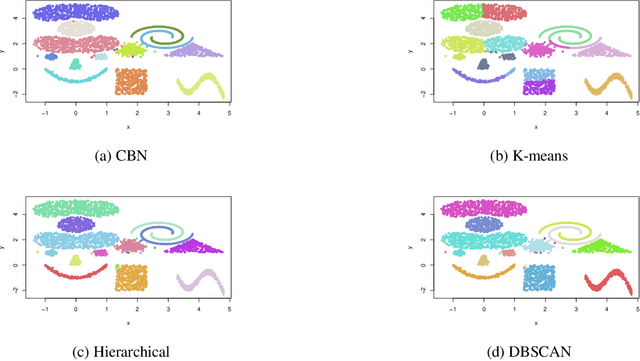
Abstract:This paper presents a new clustering algorithm for space-time data based on the concepts of topological data analysis and in particular, persistent homology. Employing persistent homology - a flexible mathematical tool from algebraic topology used to extract topological information from data - in unsupervised learning is an uncommon and a novel approach. A notable aspect of this methodology consists in analyzing data at multiple resolutions which allows to distinguish true features from noise based on the extent of their persistence. We evaluate the performance of our algorithm on synthetic data and compare it to other well-known clustering algorithms such as K-means, hierarchical clustering and DBSCAN. We illustrate its application in the context of a case study of water quality in the Chesapeake Bay.
 Add to Chrome
 Add to Firefox
 Add to Edge