Steven Hawken
Automated Classification of First-Trimester Fetal Heart Views Using Ultrasound-Specific Self-Supervised Learning
Dec 30, 2025Abstract:Congenital heart disease remains the most common congenital anomaly and a leading cause of neonatal morbidity and mortality. Although first-trimester fetal echocardiography offers an opportunity for earlier detection, automated analysis at this stage is challenging due to small cardiac structures, low signal-to-noise ratio, and substantial inter-operator variability. In this work, we evaluate a self-supervised ultrasound foundation model, USF-MAE, for first-trimester fetal heart view classification. USF-MAE is pretrained using masked autoencoding modelling on more than 370,000 unlabelled ultrasound images spanning over 40 anatomical regions and is subsequently fine-tuned for downstream classification. As a proof of concept, the pretrained Vision Transformer encoder was fine-tuned on an open-source dataset of 6,720 first-trimester fetal echocardiography images to classify five categories: aorta, atrioventricular flows, V sign, X sign, and Other. Model performance was benchmarked against supervised convolutional neural network baselines (ResNet-18 and ResNet-50) and a Vision Transformer (ViT-B/16) model pretrained on natural images (ImageNet-1k). All models were trained and evaluated using identical preprocessing, data splits, and optimization protocols. On an independent test set, USF-MAE achieved the highest performance across all evaluation metrics, with 90.57% accuracy, 91.15% precision, 90.57% recall, and 90.71% F1-score. This represents an improvement of +2.03% in accuracy and +1.98% in F1-score compared with the strongest baseline, ResNet-18. The proposed approach demonstrated robust performance without reliance on aggressive image preprocessing or region-of-interest cropping and showed improved discrimination of non-diagnostic frames.
Improved cystic hygroma detection from prenatal imaging using ultrasound-specific self-supervised representation learning
Dec 28, 2025Abstract:Cystic hygroma is a high-risk prenatal ultrasound finding that portends high rates of chromosomal abnormalities, structural malformations, and adverse pregnancy outcomes. Automated detection can increase reproducibility and support scalable early screening programs, but supervised deep learning methods are limited by small labelled datasets. This study assesses whether ultrasound-specific self-supervised pretraining can facilitate accurate, robust deep learning detection of cystic hygroma in first-trimester ultrasound images. We fine-tuned the Ultrasound Self-Supervised Foundation Model with Masked Autoencoding (USF-MAE), pretrained on over 370,000 unlabelled ultrasound images, for binary classification of normal controls and cystic hygroma cases used in this study. Performance was evaluated on the same curated ultrasound dataset, preprocessing pipeline, and 4-fold cross-validation protocol as for the DenseNet-169 baseline, using accuracy, sensitivity, specificity, and the area under the receiver operating characteristic curve (ROC-AUC). Model interpretability was analyzed qualitatively using Score-CAM visualizations. USF-MAE outperformed the DenseNet-169 baseline on all evaluation metrics. The proposed model yielded a mean accuracy of 0.96, sensitivity of 0.94, specificity of 0.98, and ROC-AUC of 0.98 compared to 0.93, 0.92, 0.94, and 0.94 for the DenseNet-169 baseline, respectively. Qualitative Score-CAM visualizations of model predictions demonstrated clinical relevance by highlighting expected regions in the fetal neck for both positive and negative cases. Paired statistical analysis using a Wilcoxon signed-rank test confirmed that performance improvements achieved by USF-MAE were statistically significant (p = 0.0057).
Self-Supervised Ultrasound Representation Learning for Renal Anomaly Prediction in Prenatal Imaging
Dec 15, 2025


Abstract:Prenatal ultrasound is the cornerstone for detecting congenital anomalies of the kidneys and urinary tract, but diagnosis is limited by operator dependence and suboptimal imaging conditions. We sought to assess the performance of a self-supervised ultrasound foundation model for automated fetal renal anomaly classification using a curated dataset of 969 two-dimensional ultrasound images. A pretrained Ultrasound Self-Supervised Foundation Model with Masked Autoencoding (USF-MAE) was fine-tuned for binary and multi-class classification of normal kidneys, urinary tract dilation, and multicystic dysplastic kidney. Models were compared with a DenseNet-169 convolutional baseline using cross-validation and an independent test set. USF-MAE consistently improved upon the baseline across all evaluation metrics in both binary and multi-class settings. USF-MAE achieved an improvement of about 1.87% (AUC) and 7.8% (F1-score) on the validation set, 2.32% (AUC) and 4.33% (F1-score) on the independent holdout test set. The largest gains were observed in the multi-class setting, where the improvement in AUC was 16.28% and 46.15% in F1-score. To facilitate model interpretability, Score-CAM visualizations were adapted for a transformer architecture and show that model predictions were informed by known, clinically relevant renal structures, including the renal pelvis in urinary tract dilation and cystic regions in multicystic dysplastic kidney. These results show that ultrasound-specific self-supervised learning can generate a useful representation as a foundation for downstream diagnostic tasks. The proposed framework offers a robust, interpretable approach to support the prenatal detection of renal anomalies and demonstrates the promise of foundation models in obstetric imaging.
Deep Learning Analysis of Prenatal Ultrasound for Identification of Ventriculomegaly
Nov 11, 2025Abstract:The proposed study aimed to develop a deep learning model capable of detecting ventriculomegaly on prenatal ultrasound images. Ventriculomegaly is a prenatal condition characterized by dilated cerebral ventricles of the fetal brain and is important to diagnose early, as it can be associated with an increased risk for fetal aneuploidies and/or underlying genetic syndromes. An Ultrasound Self-Supervised Foundation Model with Masked Autoencoding (USF-MAE), recently developed by our group, was fine-tuned for a binary classification task to distinguish fetal brain ultrasound images as either normal or showing ventriculomegaly. The USF-MAE incorporates a Vision Transformer encoder pretrained on more than 370,000 ultrasound images from the OpenUS-46 corpus. For this study, the pretrained encoder was adapted and fine-tuned on a curated dataset of fetal brain ultrasound images to optimize its performance for ventriculomegaly detection. Model evaluation was conducted using 5-fold cross-validation and an independent test cohort, and performance was quantified using accuracy, precision, recall, specificity, F1-score, and area under the receiver operating characteristic curve (AUC). The proposed USF-MAE model reached an F1-score of 91.76% on the 5-fold cross-validation and 91.78% on the independent test set, with much higher scores than those obtained by the baseline models by 19.37% and 16.15% compared to VGG-19, 2.31% and 2.56% compared to ResNet-50, and 5.03% and 11.93% compared to ViT-B/16, respectively. The model also showed a high mean test precision of 94.47% and an accuracy of 97.24%. The Eigen-CAM (Eigen Class Activation Map) heatmaps showed that the model was focusing on the ventricle area for the diagnosis of ventriculomegaly, which has explainability and clinical plausibility.
USF-MAE: Ultrasound Self-Supervised Foundation Model with Masked Autoencoding
Oct 27, 2025Abstract:Ultrasound imaging is one of the most widely used diagnostic modalities, offering real-time, radiation-free assessment across diverse clinical domains. However, interpretation of ultrasound images remains challenging due to high noise levels, operator dependence, and limited field of view, resulting in substantial inter-observer variability. Current Deep Learning approaches are hindered by the scarcity of large labeled datasets and the domain gap between general and sonographic images, which limits the transferability of models pretrained on non-medical data. To address these challenges, we introduce the Ultrasound Self-Supervised Foundation Model with Masked Autoencoding (USF-MAE), the first large-scale self-supervised MAE framework pretrained exclusively on ultrasound data. The model was pre-trained on 370,000 2D and 3D ultrasound images curated from 46 open-source datasets, collectively termed OpenUS-46, spanning over twenty anatomical regions. This curated dataset has been made publicly available to facilitate further research and reproducibility. Using a Vision Transformer encoder-decoder architecture, USF-MAE reconstructs masked image patches, enabling it to learn rich, modality-specific representations directly from unlabeled data. The pretrained encoder was fine-tuned on three public downstream classification benchmarks: BUS-BRA (breast cancer), MMOTU-2D (ovarian tumors), and GIST514-DB (gastrointestinal stromal tumors). Across all tasks, USF-MAE consistently outperformed conventional CNN and ViT baselines, achieving F1-scores of 81.6%, 79.6%, and 82.4%, respectively. Despite not using labels during pretraining, USF-MAE approached the performance of the supervised foundation model UltraSam on breast cancer classification and surpassed it on the other tasks, demonstrating strong cross-anatomical generalization.
CAManim: Animating end-to-end network activation maps
Dec 19, 2023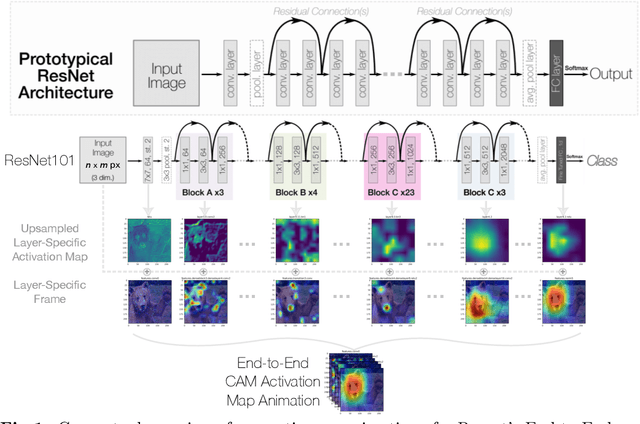

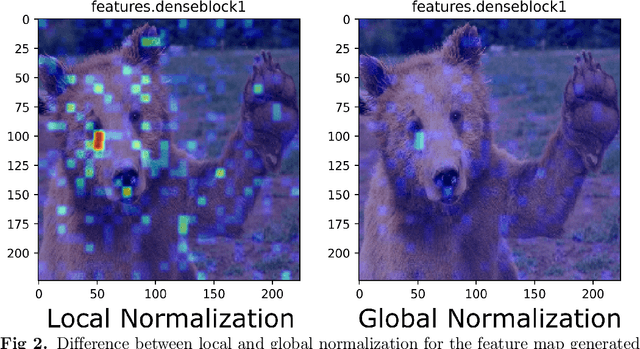
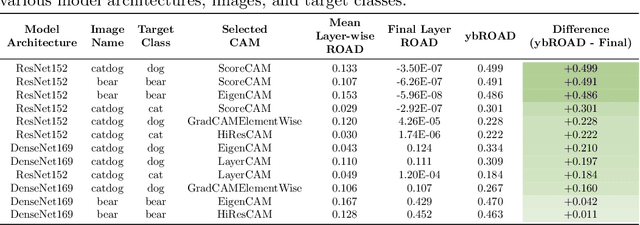
Abstract:Deep neural networks have been widely adopted in numerous domains due to their high performance and accessibility to developers and application-specific end-users. Fundamental to image-based applications is the development of Convolutional Neural Networks (CNNs), which possess the ability to automatically extract features from data. However, comprehending these complex models and their learned representations, which typically comprise millions of parameters and numerous layers, remains a challenge for both developers and end-users. This challenge arises due to the absence of interpretable and transparent tools to make sense of black-box models. There exists a growing body of Explainable Artificial Intelligence (XAI) literature, including a collection of methods denoted Class Activation Maps (CAMs), that seek to demystify what representations the model learns from the data, how it informs a given prediction, and why it, at times, performs poorly in certain tasks. We propose a novel XAI visualization method denoted CAManim that seeks to simultaneously broaden and focus end-user understanding of CNN predictions by animating the CAM-based network activation maps through all layers, effectively depicting from end-to-end how a model progressively arrives at the final layer activation. Herein, we demonstrate that CAManim works with any CAM-based method and various CNN architectures. Beyond qualitative model assessments, we additionally propose a novel quantitative assessment that expands upon the Remove and Debias (ROAD) metric, pairing the qualitative end-to-end network visual explanations assessment with our novel quantitative "yellow brick ROAD" assessment (ybROAD). This builds upon prior research to address the increasing demand for interpretable, robust, and transparent model assessment methodology, ultimately improving an end-user's trust in a given model's predictions.
MetaCAM: Ensemble-Based Class Activation Map
Jul 31, 2023
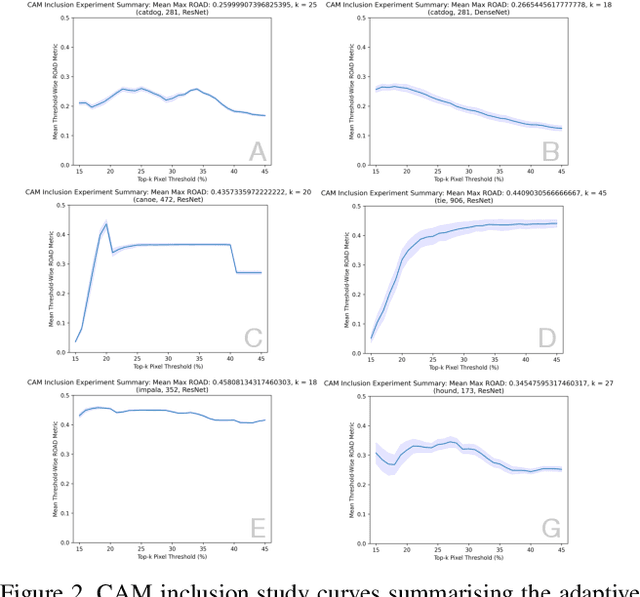
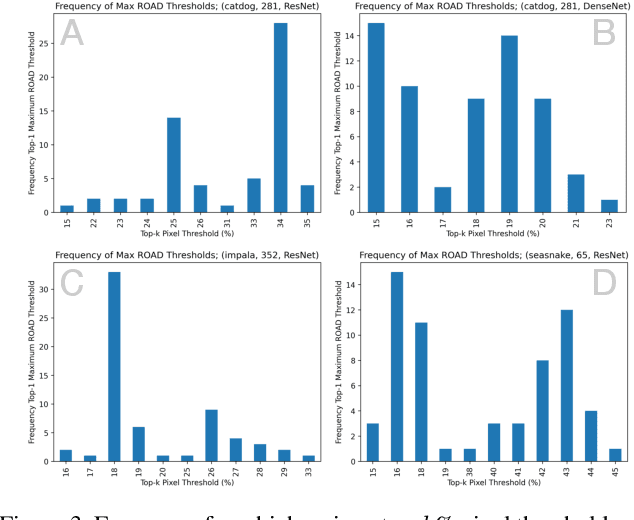
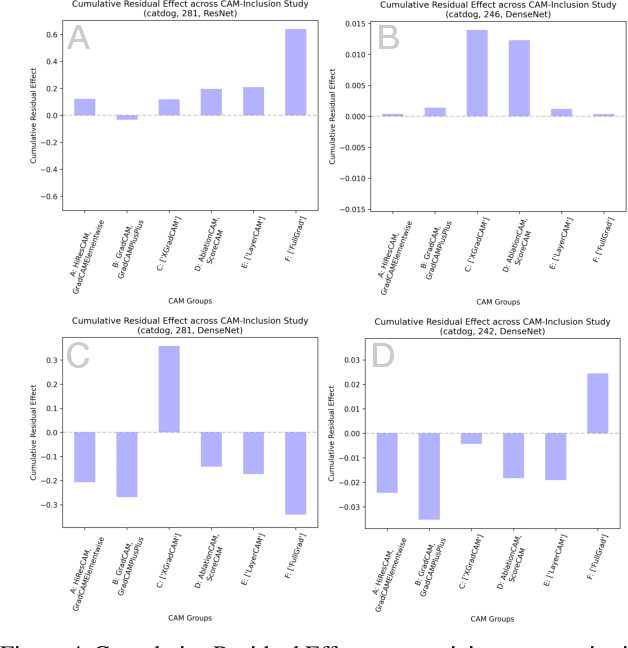
Abstract:The need for clear, trustworthy explanations of deep learning model predictions is essential for high-criticality fields, such as medicine and biometric identification. Class Activation Maps (CAMs) are an increasingly popular category of visual explanation methods for Convolutional Neural Networks (CNNs). However, the performance of individual CAMs depends largely on experimental parameters such as the selected image, target class, and model. Here, we propose MetaCAM, an ensemble-based method for combining multiple existing CAM methods based on the consensus of the top-k% most highly activated pixels across component CAMs. We perform experiments to quantifiably determine the optimal combination of 11 CAMs for a given MetaCAM experiment. A new method denoted Cumulative Residual Effect (CRE) is proposed to summarize large-scale ensemble-based experiments. We also present adaptive thresholding and demonstrate how it can be applied to individual CAMs to improve their performance, measured using pixel perturbation method Remove and Debias (ROAD). Lastly, we show that MetaCAM outperforms existing CAMs and refines the most salient regions of images used for model predictions. In a specific example, MetaCAM improved ROAD performance to 0.393 compared to 11 individual CAMs with ranges from -0.101-0.172, demonstrating the importance of combining CAMs through an ensembling method and adaptive thresholding.
Deep ROC Analysis and AUC as Balanced Average Accuracy to Improve Model Selection, Understanding and Interpretation
Mar 21, 2021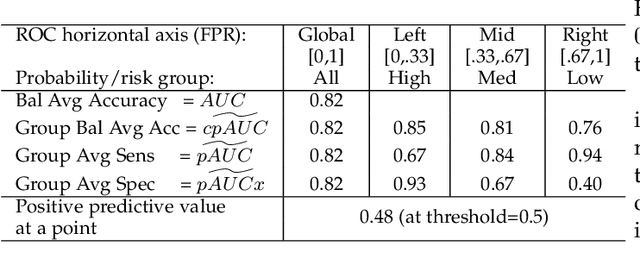
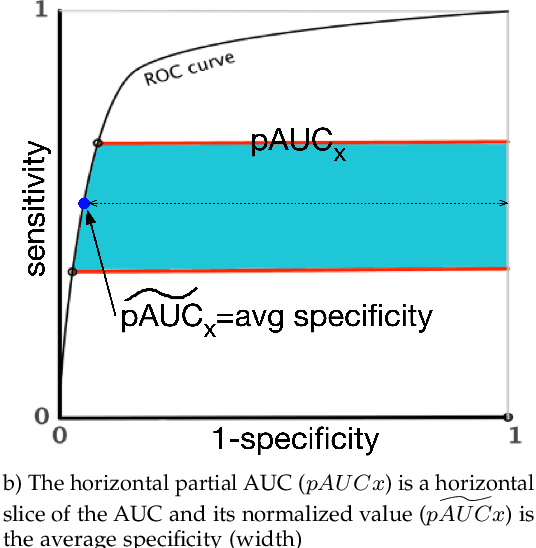
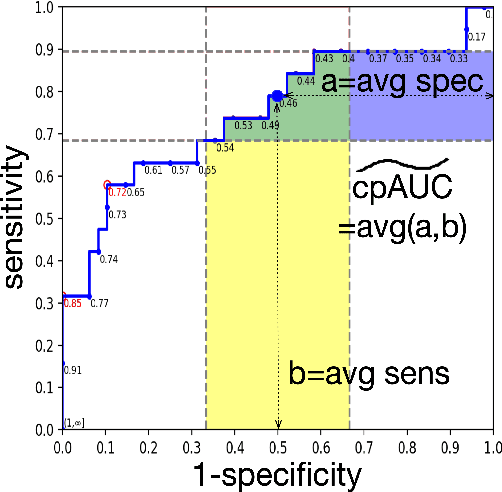
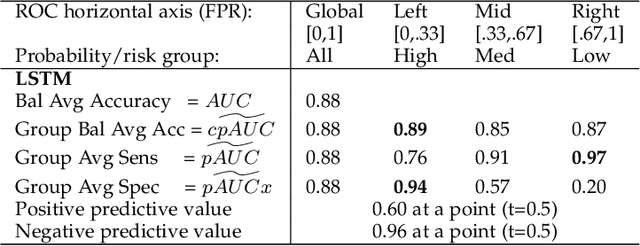
Abstract:Optimal performance is critical for decision-making tasks from medicine to autonomous driving, however common performance measures may be too general or too specific. For binary classifiers, diagnostic tests or prognosis at a timepoint, measures such as the area under the receiver operating characteristic curve, or the area under the precision recall curve, are too general because they include unrealistic decision thresholds. On the other hand, measures such as accuracy, sensitivity or the F1 score are measures at a single threshold that reflect an individual single probability or predicted risk, rather than a range of individuals or risk. We propose a method in between, deep ROC analysis, that examines groups of probabilities or predicted risks for more insightful analysis. We translate esoteric measures into familiar terms: AUC and the normalized concordant partial AUC are balanced average accuracy (a new finding); the normalized partial AUC is average sensitivity; and the normalized horizontal partial AUC is average specificity. Along with post-test measures, we provide a method that can improve model selection in some cases and provide interpretation and assurance for patients in each risk group. We demonstrate deep ROC analysis in two case studies and provide a toolkit in Python.
 Add to Chrome
 Add to Firefox
 Add to Edge