CAManim: Animating end-to-end network activation maps
Paper and Code
Dec 19, 2023


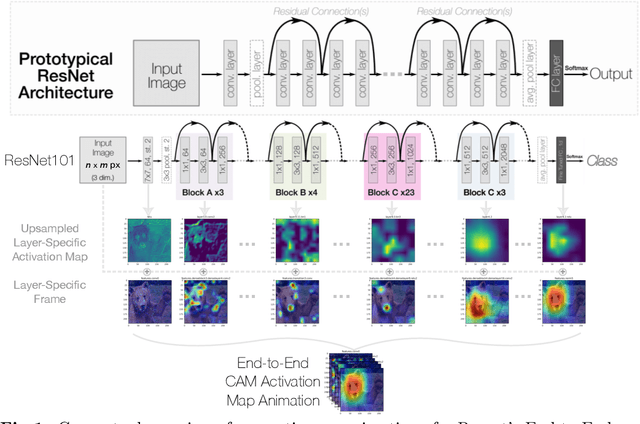
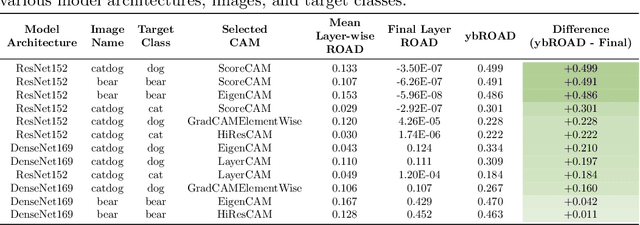
Deep neural networks have been widely adopted in numerous domains due to their high performance and accessibility to developers and application-specific end-users. Fundamental to image-based applications is the development of Convolutional Neural Networks (CNNs), which possess the ability to automatically extract features from data. However, comprehending these complex models and their learned representations, which typically comprise millions of parameters and numerous layers, remains a challenge for both developers and end-users. This challenge arises due to the absence of interpretable and transparent tools to make sense of black-box models. There exists a growing body of Explainable Artificial Intelligence (XAI) literature, including a collection of methods denoted Class Activation Maps (CAMs), that seek to demystify what representations the model learns from the data, how it informs a given prediction, and why it, at times, performs poorly in certain tasks. We propose a novel XAI visualization method denoted CAManim that seeks to simultaneously broaden and focus end-user understanding of CNN predictions by animating the CAM-based network activation maps through all layers, effectively depicting from end-to-end how a model progressively arrives at the final layer activation. Herein, we demonstrate that CAManim works with any CAM-based method and various CNN architectures. Beyond qualitative model assessments, we additionally propose a novel quantitative assessment that expands upon the Remove and Debias (ROAD) metric, pairing the qualitative end-to-end network visual explanations assessment with our novel quantitative "yellow brick ROAD" assessment (ybROAD). This builds upon prior research to address the increasing demand for interpretable, robust, and transparent model assessment methodology, ultimately improving an end-user's trust in a given model's predictions.
 Add to Chrome
 Add to Firefox
 Add to Edge