Shaun R. Levick
Spatioformer: A Geo-encoded Transformer for Large-Scale Plant Species Richness Prediction
Oct 25, 2024Abstract:Earth observation data have shown promise in predicting species richness of vascular plants ($\alpha$-diversity), but extending this approach to large spatial scales is challenging because geographically distant regions may exhibit different compositions of plant species ($\beta$-diversity), resulting in a location-dependent relationship between richness and spectral measurements. In order to handle such geolocation dependency, we propose Spatioformer, where a novel geolocation encoder is coupled with the transformer model to encode geolocation context into remote sensing imagery. The Spatioformer model compares favourably to state-of-the-art models in richness predictions on a large-scale ground-truth richness dataset (HAVPlot) that consists of 68,170 in-situ richness samples covering diverse landscapes across Australia. The results demonstrate that geolocational information is advantageous in predicting species richness from satellite observations over large spatial scales. With Spatioformer, plant species richness maps over Australia are compiled from Landsat archive for the years from 2015 to 2023. The richness maps produced in this study reveal the spatiotemporal dynamics of plant species richness in Australia, providing supporting evidence to inform effective planning and policy development for plant diversity conservation. Regions of high richness prediction uncertainties are identified, highlighting the need for future in-situ surveys to be conducted in these areas to enhance the prediction accuracy.
Benchmarking tree species classification from proximally-sensed laser scanning data: introducing the FOR-species20K dataset
Aug 12, 2024Abstract:Proximally-sensed laser scanning offers significant potential for automated forest data capture, but challenges remain in automatically identifying tree species without additional ground data. Deep learning (DL) shows promise for automation, yet progress is slowed by the lack of large, diverse, openly available labeled datasets of single tree point clouds. This has impacted the robustness of DL models and the ability to establish best practices for species classification. To overcome these challenges, the FOR-species20K benchmark dataset was created, comprising over 20,000 tree point clouds from 33 species, captured using terrestrial (TLS), mobile (MLS), and drone laser scanning (ULS) across various European forests, with some data from other regions. This dataset enables the benchmarking of DL models for tree species classification, including both point cloud-based (PointNet++, MinkNet, MLP-Mixer, DGCNNs) and multi-view image-based methods (SimpleView, DetailView, YOLOv5). 2D image-based models generally performed better (average OA = 0.77) than 3D point cloud-based models (average OA = 0.72), with consistent results across different scanning platforms and sensors. The top model, DetailView, was particularly robust, handling data imbalances well and generalizing effectively across tree sizes. The FOR-species20K dataset, available at https://zenodo.org/records/13255198, is a key resource for developing and benchmarking DL models for tree species classification using laser scanning data, providing a foundation for future advancements in the field.
Plant species richness prediction from DESIS hyperspectral data: A comparison study on feature extraction procedures and regression models
Jan 05, 2023


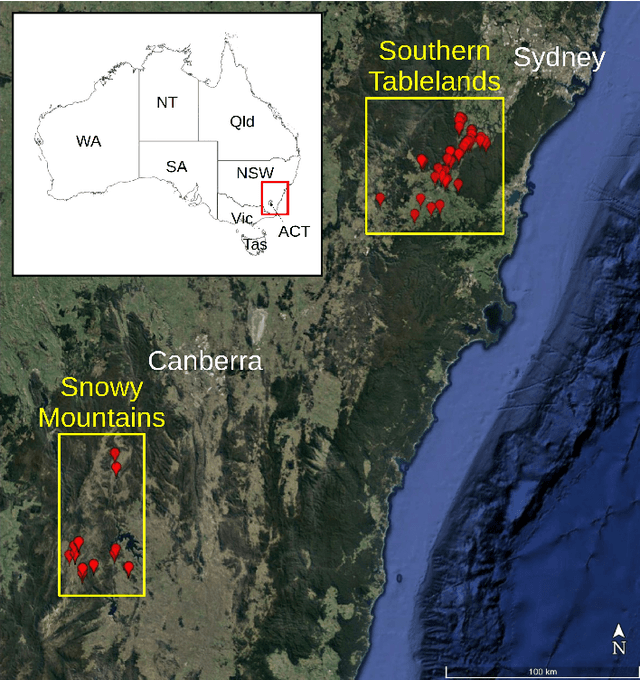
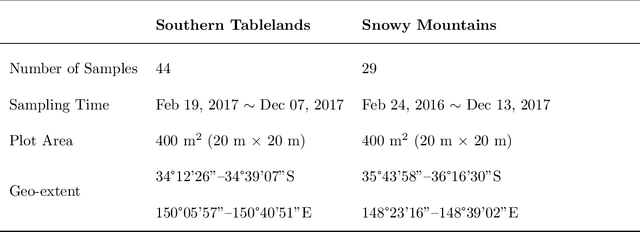
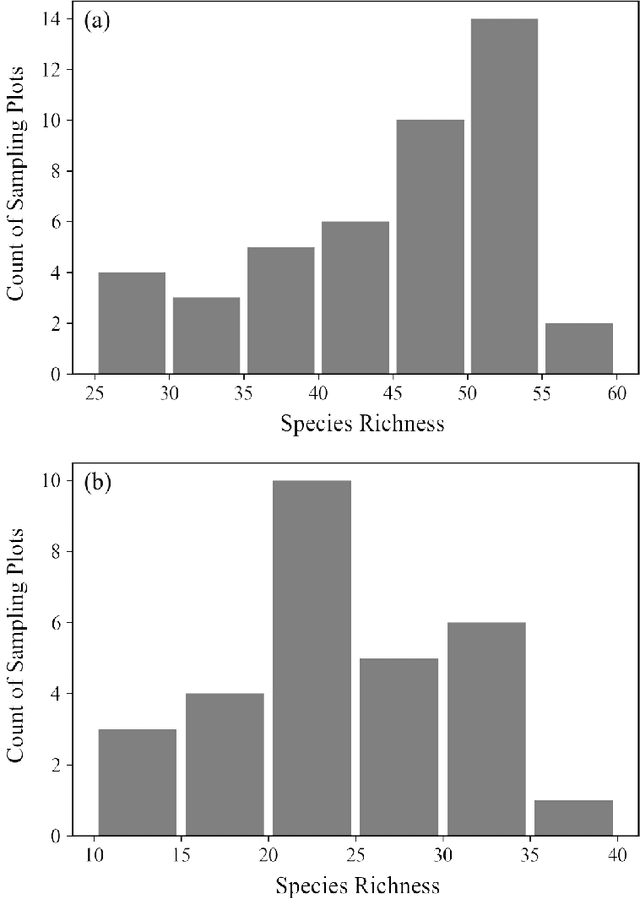
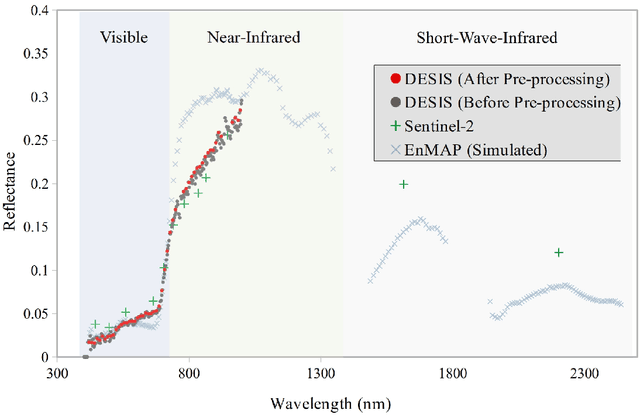
Abstract:The diversity of terrestrial vascular plants plays a key role in maintaining the stability and productivity of ecosystems. Monitoring species compositional diversity across large spatial scales is challenging and time consuming. The advanced spectral and spatial specification of the recently launched DESIS (the DLR Earth Sensing Imaging Spectrometer) instrument provides a unique opportunity to test the potential for monitoring plant species diversity with spaceborne hyperspectral data. This study provides a quantitative assessment on the ability of DESIS hyperspectral data for predicting plant species richness in two different habitat types in southeast Australia. Spectral features were first extracted from the DESIS spectra, then regressed against on-ground estimates of plant species richness, with a two-fold cross validation scheme to assess the predictive performance. We tested and compared the effectiveness of Principal Component Analysis (PCA), Canonical Correlation Analysis (CCA), and Partial Least Squares analysis (PLS) for feature extraction, and Kernel Ridge Regression (KRR), Gaussian Process Regression (GPR), Random Forest Regression (RFR) for species richness prediction. The best prediction results were r=0.76 and RMSE=5.89 for the Southern Tablelands region, and r=0.68 and RMSE=5.95 for the Snowy Mountains region. Relative importance analysis for the DESIS spectral bands showed that the red-edge, red, and blue spectral regions were more important for predicting plant species richness than the green bands and the near-infrared bands beyond red-edge. We also found that the DESIS hyperspectral data performed better than Sentinel-2 multispectral data in the prediction of plant species richness. Our results provide a quantitative reference for future studies exploring the potential of spaceborne hyperspectral data for plant biodiversity mapping.
Quantitative Assessment of DESIS Hyperspectral Data for Plant Biodiversity Estimation in Australia
Jul 06, 2022


Abstract:Diversity of terrestrial plants plays a key role in maintaining a stable, healthy, and productive ecosystem. Though remote sensing has been seen as a promising and cost-effective proxy for estimating plant diversity, there is a lack of quantitative studies on how confidently plant diversity can be inferred from spaceborne hyperspectral data. In this study, we assessed the ability of hyperspectral data captured by the DLR Earth Sensing Imaging Spectrometer (DESIS) for estimating plant species richness in the Southern Tablelands and Snowy Mountains regions in southeast Australia. Spectral features were firstly extracted from DESIS spectra with principal component analysis, canonical correlation analysis, and partial least squares analysis. Then regression was conducted between the extracted features and plant species richness with ordinary least squares regression, kernel ridge regression, and Gaussian process regression. Results were assessed with the coefficient of correlation ($r$) and Root-Mean-Square Error (RMSE), based on a two-fold cross validation scheme. With the best performing model, $r$ is 0.71 and RMSE is 5.99 for the Southern Tablelands region, while $r$ is 0.62 and RMSE is 6.20 for the Snowy Mountains region. The assessment results reported in this study provide supports for future studies on understanding the relationship between spaceborne hyperspectral measurements and terrestrial plant biodiversity.
 Add to Chrome
 Add to Firefox
 Add to Edge