Saleem Ahmed
RealCQA-V2 : Visual Premise Proving
Oct 29, 2024Abstract:We introduce Visual Premise Proving (VPP), a novel task tailored to refine the process of chart question answering by deconstructing it into a series of logical premises. Each of these premises represents an essential step in comprehending a chart's content and deriving logical conclusions, thereby providing a granular look at a model's reasoning abilities. This approach represents a departure from conventional accuracy-based evaluation methods, emphasizing the model's ability to sequentially validate each premise and ideally mimic human analytical processes. A model adept at reasoning is expected to demonstrate proficiency in both data retrieval and the structural understanding of charts, suggesting a synergy between these competencies. However, in our zero-shot study using the sophisticated MATCHA model on a scientific chart question answering dataset, an intriguing pattern emerged. The model showcased superior performance in chart reasoning (27\%) over chart structure (19\%) and data retrieval (14\%). This performance gap suggests that models might more readily generalize reasoning capabilities across datasets, benefiting from consistent mathematical and linguistic semantics, even when challenged by changes in the visual domain that complicate structure comprehension and data retrieval. Furthermore, the efficacy of using accuracy of binary QA for evaluating chart reasoning comes into question if models can deduce correct answers without parsing chart data or structure. VPP highlights the importance of integrating reasoning with visual comprehension to enhance model performance in chart analysis, pushing for a balanced approach in evaluating visual data interpretation capabilities.
SpaDen : Sparse and Dense Keypoint Estimation for Real-World Chart Understanding
Aug 03, 2023


Abstract:We introduce a novel bottom-up approach for the extraction of chart data. Our model utilizes images of charts as inputs and learns to detect keypoints (KP), which are used to reconstruct the components within the plot area. Our novelty lies in detecting a fusion of continuous and discrete KP as predicted heatmaps. A combination of sparse and dense per-pixel objectives coupled with a uni-modal self-attention-based feature-fusion layer is applied to learn KP embeddings. Further leveraging deep metric learning for unsupervised clustering, allows us to segment the chart plot area into various objects. By further matching the chart components to the legend, we are able to obtain the data series names. A post-processing threshold is applied to the KP embeddings to refine the object reconstructions and improve accuracy. Our extensive experiments include an evaluation of different modules for KP estimation and the combination of deep layer aggregation and corner pooling approaches. The results of our experiments provide extensive evaluation for the task of real-world chart data extraction.
RealCQA: Scientific Chart Question Answering as a Test-bed for First-Order Logic
Aug 03, 2023


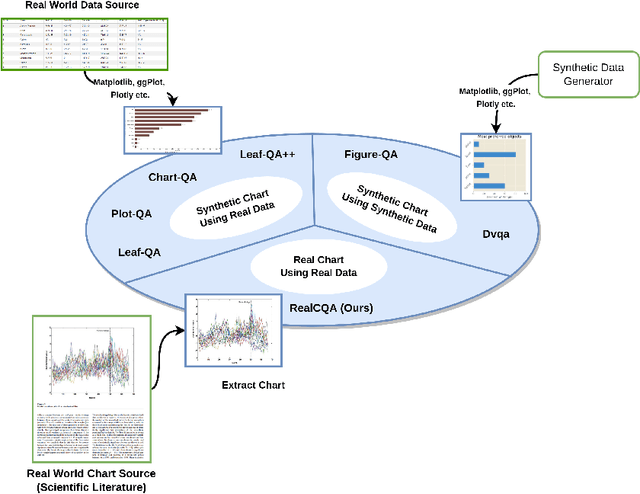
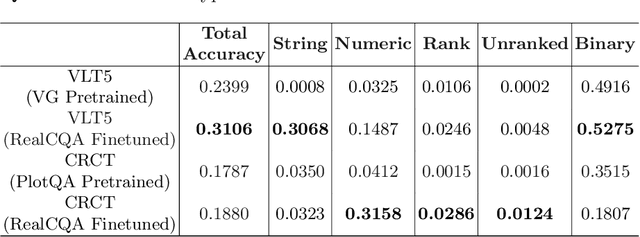
Abstract:We present a comprehensive study of chart visual question-answering(QA) task, to address the challenges faced in comprehending and extracting data from chart visualizations within documents. Despite efforts to tackle this problem using synthetic charts, solutions are limited by the shortage of annotated real-world data. To fill this gap, we introduce a benchmark and dataset for chart visual QA on real-world charts, offering a systematic analysis of the task and a novel taxonomy for template-based chart question creation. Our contribution includes the introduction of a new answer type, 'list', with both ranked and unranked variations. Our study is conducted on a real-world chart dataset from scientific literature, showcasing higher visual complexity compared to other works. Our focus is on template-based QA and how it can serve as a standard for evaluating the first-order logic capabilities of models. The results of our experiments, conducted on a real-world out-of-distribution dataset, provide a robust evaluation of large-scale pre-trained models and advance the field of chart visual QA and formal logic verification for neural networks in general.
Context-Aware Chart Element Detection
May 07, 2023Abstract:As a prerequisite of chart data extraction, the accurate detection of chart basic elements is essential and mandatory. In contrast to object detection in the general image domain, chart element detection relies heavily on context information as charts are highly structured data visualization formats. To address this, we propose a novel method CACHED, which stands for Context-Aware Chart Element Detection, by integrating a local-global context fusion module consisting of visual context enhancement and positional context encoding with the Cascade R-CNN framework. To improve the generalization of our method for broader applicability, we refine the existing chart element categorization and standardized 18 classes for chart basic elements, excluding plot elements. Our CACHED method, with the updated category of chart elements, achieves state-of-the-art performance in our experiments, underscoring the importance of context in chart element detection. Extending our method to the bar plot detection task, we obtain the best result on the PMC test dataset.
 Add to Chrome
 Add to Firefox
 Add to Edge