RealCQA: Scientific Chart Question Answering as a Test-bed for First-Order Logic
Paper and Code
Aug 03, 2023


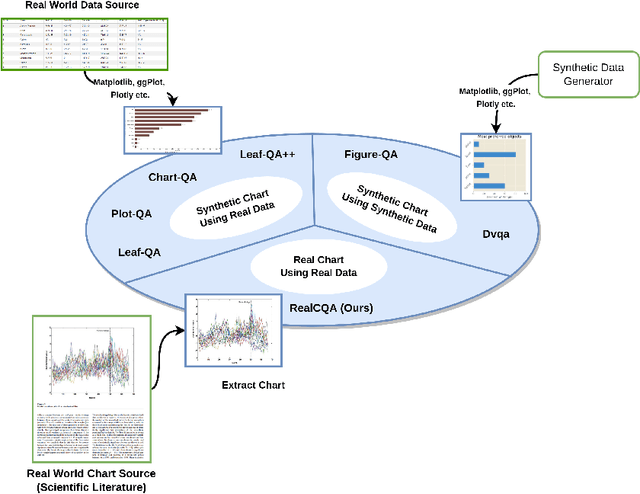
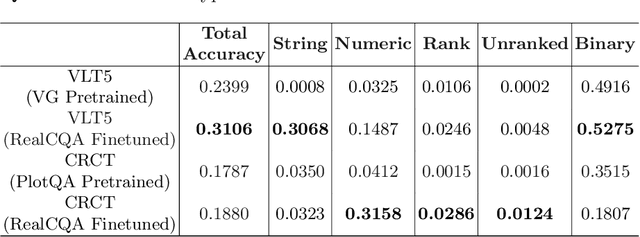
We present a comprehensive study of chart visual question-answering(QA) task, to address the challenges faced in comprehending and extracting data from chart visualizations within documents. Despite efforts to tackle this problem using synthetic charts, solutions are limited by the shortage of annotated real-world data. To fill this gap, we introduce a benchmark and dataset for chart visual QA on real-world charts, offering a systematic analysis of the task and a novel taxonomy for template-based chart question creation. Our contribution includes the introduction of a new answer type, 'list', with both ranked and unranked variations. Our study is conducted on a real-world chart dataset from scientific literature, showcasing higher visual complexity compared to other works. Our focus is on template-based QA and how it can serve as a standard for evaluating the first-order logic capabilities of models. The results of our experiments, conducted on a real-world out-of-distribution dataset, provide a robust evaluation of large-scale pre-trained models and advance the field of chart visual QA and formal logic verification for neural networks in general.
 Add to Chrome
 Add to Firefox
 Add to Edge