Rita Borgo
Visual Analytics for Fine-grained Text Classification Models and Datasets
Mar 21, 2024Abstract:In natural language processing (NLP), text classification tasks are increasingly fine-grained, as datasets are fragmented into a larger number of classes that are more difficult to differentiate from one another. As a consequence, the semantic structures of datasets have become more complex, and model decisions more difficult to explain. Existing tools, suited for coarse-grained classification, falter under these additional challenges. In response to this gap, we worked closely with NLP domain experts in an iterative design-and-evaluation process to characterize and tackle the growing requirements in their workflow of developing fine-grained text classification models. The result of this collaboration is the development of SemLa, a novel visual analytics system tailored for 1) dissecting complex semantic structures in a dataset when it is spatialized in model embedding space, and 2) visualizing fine-grained nuances in the meaning of text samples to faithfully explain model reasoning. This paper details the iterative design study and the resulting innovations featured in SemLa. The final design allows contrastive analysis at different levels by unearthing lexical and conceptual patterns including biases and artifacts in data. Expert feedback on our final design and case studies confirm that SemLa is a useful tool for supporting model validation and debugging as well as data annotation.
Reclaiming the Horizon: Novel Visualization Designs for Time-Series Data with Large Value Ranges
Jul 18, 2023Abstract:We introduce two novel visualization designs to support practitioners in performing identification and discrimination tasks on large value ranges (i.e., several orders of magnitude) in time-series data: (1) The order of magnitude horizon graph, which extends the classic horizon graph; and (2) the order of magnitude line chart, which adapts the log-line chart. These new visualization designs visualize large value ranges by explicitly splitting the mantissa m and exponent e of a value v = m * 10e . We evaluate our novel designs against the most relevant state-of-the-art visualizations in an empirical user study. It focuses on four main tasks commonly employed in the analysis of time-series and large value ranges visualization: identification, discrimination, estimation, and trend detection. For each task we analyse error, confidence, and response time. The new order of magnitude horizon graph performs better or equal to all other designs in identification, discrimination, and estimation tasks. Only for trend detection tasks, the more traditional horizon graphs reported better performance. Our results are domain-independent, only requiring time-series data with large value ranges.
The Development of Visualization Psychology Analysis Tools to Account for Trust
Sep 28, 2020
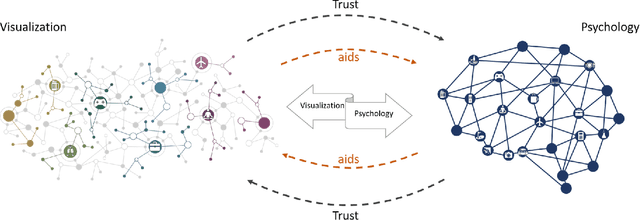
Abstract:Defining trust is an important endeavor given its applicability to assessing public mood to much of the innovation in the newly formed autonomous industry, such as artificial intelligence (AI),medical bots, drones, autonomous vehicles, and smart factories [19].Through developing a reliable index or means to measure trust,this may have wide impact from fostering acceptance and adoption of smart systems to informing policy makers about the public atmosphere and willingness to adopt innovate change, and has been identified as an important indicator in a recent UK policy brief [8].In this paper, we reflect on the importance and potential impact of developing Visualization Psychology in the context of solving definitions and policy decision making problems for complex constructs such as "trust".
Towards Providing Explanations for AI Planner Decisions
Oct 15, 2018


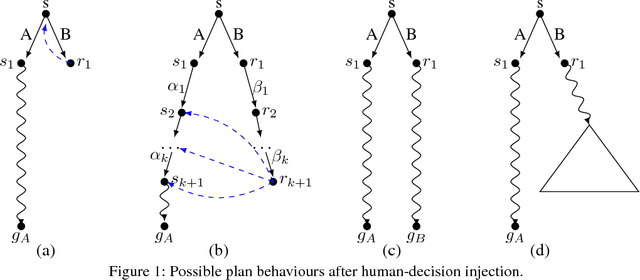
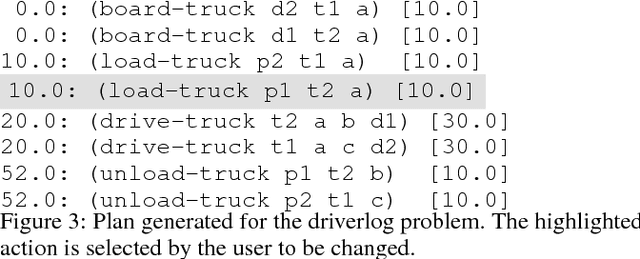
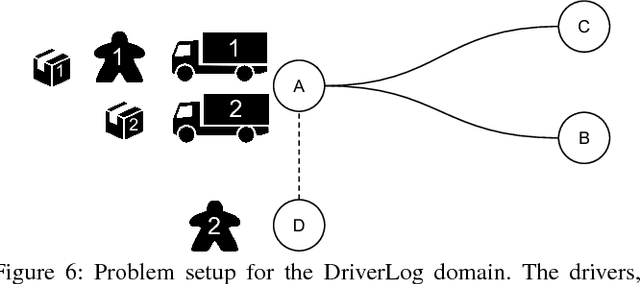
Abstract:In order to engender trust in AI, humans must understand what an AI system is trying to achieve, and why. To overcome this problem, the underlying AI process must produce justifications and explanations that are both transparent and comprehensible to the user. AI Planning is well placed to be able to address this challenge. In this paper we present a methodology to provide initial explanations for the decisions made by the planner. Explanations are created by allowing the user to suggest alternative actions in plans and then compare the resulting plans with the one found by the planner. The methodology is implemented in the new XAI-Plan framework.
 Add to Chrome
 Add to Firefox
 Add to Edge