Ranjan Maitra
Optimized $k$-means color quantization of digital images in machine-based and human perception-based colorspaces
Jan 27, 2026Abstract:Color quantization represents an image using a fraction of its original number of colors while only minimally losing its visual quality. The $k$-means algorithm is commonly used in this context, but has mostly been applied in the machine-based RGB colorspace composed of the three primary colors. However, some recent studies have indicated its improved performance in human perception-based colorspaces. We investigated the performance of $k$-means color quantization at four quantization levels in the RGB, CIE-XYZ, and CIE-LUV/CIE-HCL colorspaces, on 148 varied digital images spanning a wide range of scenes, subjects and settings. The Visual Information Fidelity (VIF) measure numerically assessed the quality of the quantized images, and showed that in about half of the cases, $k$-means color quantization is best in the RGB space, while at other times, and especially for higher quantization levels ($k$), the CIE-XYZ colorspace is where it usually does better. There are also some cases, especially at lower $k$, where the best performance is obtained in the CIE-LUV colorspace. Further analysis of the performances in terms of the distributions of the hue, chromaticity and luminance in an image presents a nuanced perspective and characterization of the images for which each colorspace is better for $k$-means color quantization.
The envelope of a complex Gaussian random variable
May 07, 2023Abstract:This article explicitly characterizes the distribution of the envelope of an elliplical Gaussian complex vector, or equivalently, the norm of a bivariate normal random vector with general covariance structure. The probability density and cumulative distribution functions are explicitly derived. Some properties of the distribution, specifically, its moments and moment generating functions, are also derived and shown to exist. These functions and expressions are exploited to also characterize the special case distributions where the bivariate Gaussian mean vector and covariance matrix have some simple structure.
Elliptically-Contoured Tensor-variate Distributions with Application to Improved Image Learning
Nov 13, 2022Abstract:Statistical analysis of tensor-valued data has largely used the tensor-variate normal (TVN) distribution that may be inadequate when data comes from distributions with heavier or lighter tails. We study a general family of elliptically contoured (EC) tensor-variate distributions and derive its characterizations, moments, marginal and conditional distributions, and the EC Wishart distribution. We describe procedures for maximum likelihood estimation from data that are (1) uncorrelated draws from an EC distribution, (2) from a scale mixture of the TVN distribution, and (3) from an underlying but unknown EC distribution, where we extend Tyler's robust estimator. A detailed simulation study highlights the benefits of choosing an EC distribution over the TVN for heavier-tailed data. We develop tensor-variate classification rules using discriminant analysis and EC errors and show that they better predict cats and dogs from images in the Animal Faces-HQ dataset than the TVN-based rules. A novel tensor-on-tensor regression and tensor-variate analysis of variance (TANOVA) framework under EC errors is also demonstrated to better characterize gender, age and ethnic origin than the usual TVN-based TANOVA in the celebrated Labeled Faces of the Wild dataset.
Exploratory Factor Analysis of Data on a Sphere
Nov 09, 2021
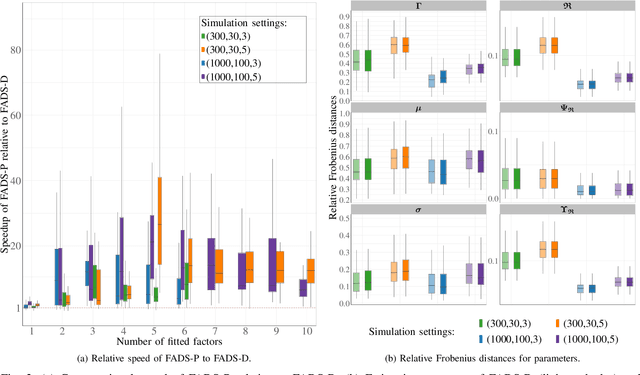
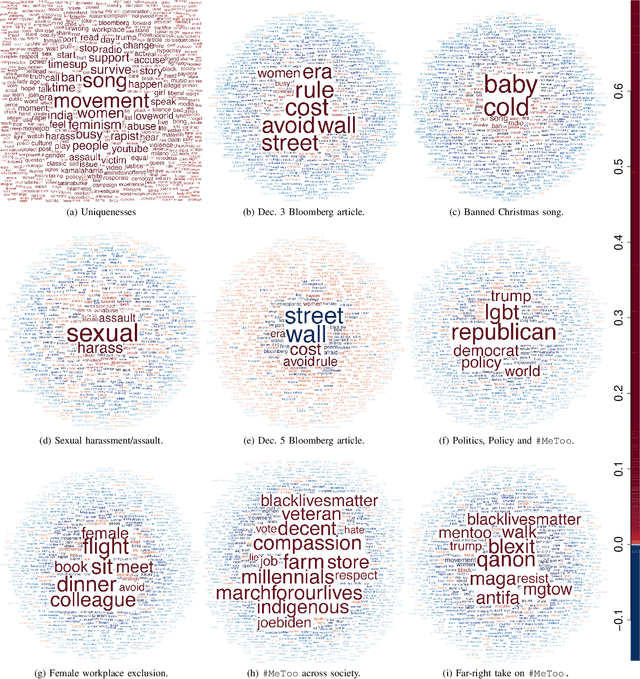
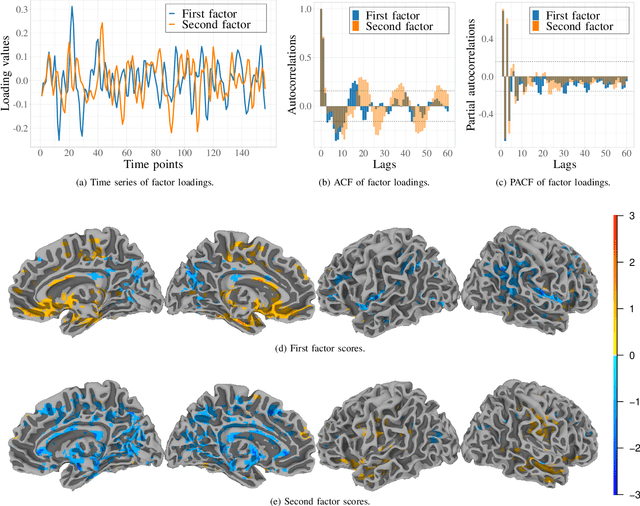
Abstract:Data on high-dimensional spheres arise frequently in many disciplines either naturally or as a consequence of preliminary processing and can have intricate dependence structure that needs to be understood. We develop exploratory factor analysis of the projected normal distribution to explain the variability in such data using a few easily interpreted latent factors. Our methodology provides maximum likelihood estimates through a novel fast alternating expectation profile conditional maximization algorithm. Results on simulation experiments on a wide range of settings are uniformly excellent. Our methodology provides interpretable and insightful results when applied to tweets with the $\#MeToo$ hashtag in early December 2018, to time-course functional Magnetic Resonance Images of the average pre-teen brain at rest, to characterize handwritten digits, and to gene expression data from cancerous cells in the Cancer Genome Atlas.
Fully Three-dimensional Radial Visualization
Oct 19, 2021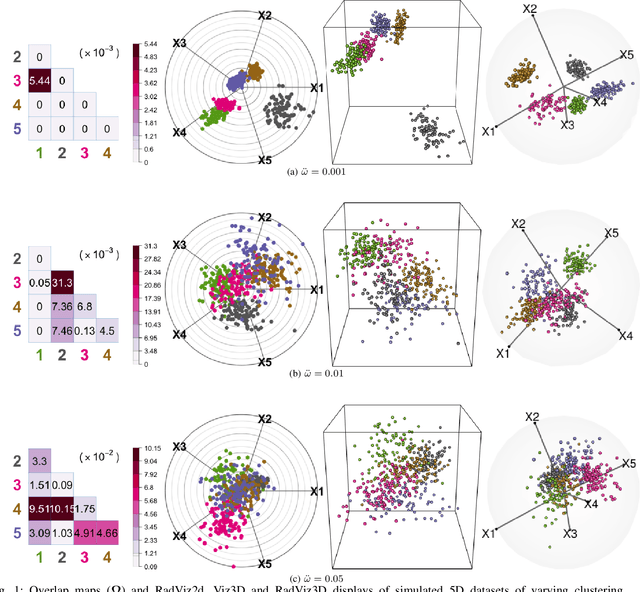


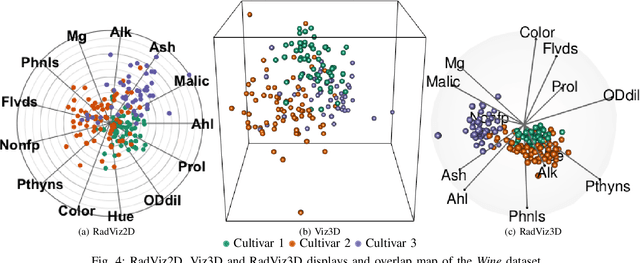
Abstract:We develop methodology for three-dimensional (3D) radial visualization (RadViz) of multidimensional datasets. The classical two-dimensional (2D) RadViz visualizes multivariate data in the 2D plane by mapping every observation to a point inside the unit circle. Our tool, RadViz3D, distributes anchor points uniformly on the 3D unit sphere. We show that this uniform distribution provides the best visualization with minimal artificial visual correlation for data with uncorrelated variables. However, anchor points can be placed exactly equi-distant from each other only for the five Platonic solids, so we provide equi-distant anchor points for these five settings, and approximately equi-distant anchor points via a Fibonacci grid for the other cases. Our methodology, implemented in the R package $radviz3d$, makes fully 3D RadViz possible and is shown to improve the ability of this nonlinear technique in more faithfully displaying simulated data as well as the crabs, olive oils and wine datasets. Additionally, because radial visualization is naturally suited for compositional data, we use RadViz3D to illustrate (i) the chemical composition of Longquan celadon ceramics and their Jingdezhen imitation over centuries, and (ii) US regional SARS-Cov-2 variants' prevalence in the Covid-19 pandemic during the summer 2021 surge of the Delta variant.
Quantitative Matching of Forensic Evidence Fragments Utilizing 3D Microscopy Analysis of Fracture Surface Replicas
Sep 24, 2021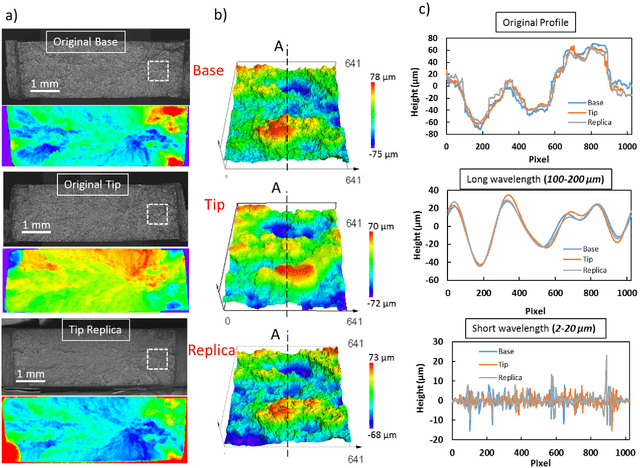
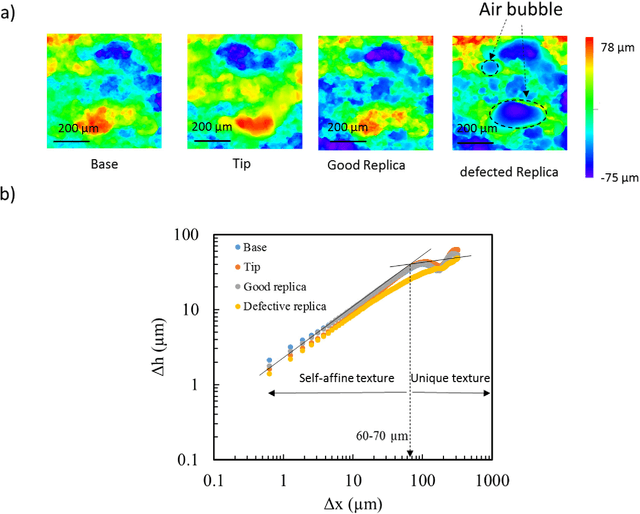
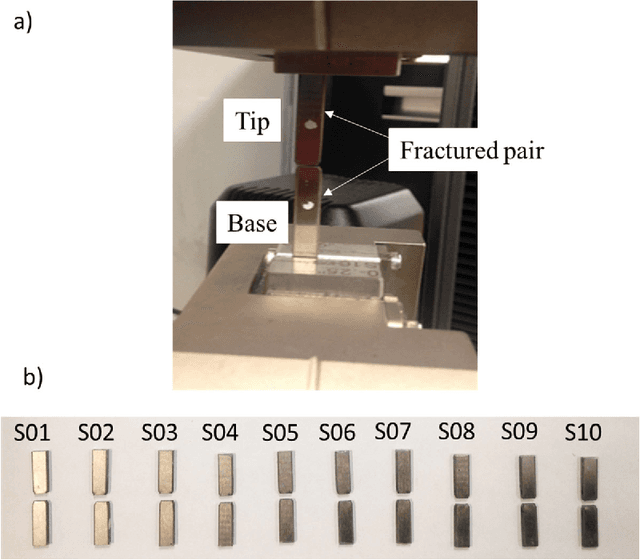

Abstract:Fractured surfaces carry unique details that can provide an accurate quantitative comparison to support comparative forensic analysis of those fractured surfaces. In this study, a statistical analysis comparison protocol was applied to a set of 3D topological images of fractured surface pairs and their replicas to provide confidence in the quantitative statistical comparison between fractured items and their replicas. A set of 10 fractured stainless steel samples was fractured from the same metal rod under controlled conditions and were cast using a standard forensic casting technique. Six 3D topological maps with 50% overlap were acquired for each fractured pair. Spectral analysis was utilized to identify the correlation between topological surface features at different length scales of the surface topology. We selected two frequency bands over the critical wavelength (which is greater than two-grain diameters) for statistical comparison. Our statistical model utilized a matrix-variate-$t$ distribution that accounts for the image-overlap to model the match and non-match population densities. A decision rule was developed to identify the probability of matched and unmatched pairs of surfaces. The proposed methodology correctly classified the fractured steel surfaces and their replicas with a posterior probability of match exceeding 99.96%. Moreover, the replication technique shows the potential to accurately replicate fracture surface topological details with a wavelength greater than 20$\mu$m, which far exceeds the range for comparison of most metallic alloys of 50-200$\mu$m. The developed framework establishes the basis of forensic comparison of fractured articles and their replicas while providing a reliable quantitative statistical forensic comparison, utilizing fracture mechanics-based analysis of the fracture surface topology.
Model-based clustering of partial records
Mar 30, 2021


Abstract:Partially recorded data are frequently encountered in many applications. In practice, such datasets are usually clustered by removing incomplete cases or features with missing values, or by imputing missing values, followed by application of a clustering algorithm to the resulting altered data set. Here, we develop clustering methodology through a model-based approach using the marginal density for the observed values, using a finite mixture model of multivariate $t$ distributions. We compare our algorithm to the corresponding full expectation-maximization (EM) approach that considers the missing values in the incomplete data set and makes a missing at random (MAR) assumption, as well as case deletion and imputation. Since only the observed values are utilized, our approach is computationally more efficient than imputation or full EM. Simulation studies demonstrate that our approach has favorable recovery of the true cluster partition compared to case deletion and imputation under various missingness mechanisms, and is more robust to extreme MAR violations than the full EM approach since it does not use the observed values to inform those that are missing. Our methodology is demonstrated on a problem of clustering gamma-ray bursts and is implemented in the https://github.com/emilygoren/MixtClust R package.
A Practical Model-based Segmentation Approach for Accurate Activation Detection in Single-Subject functional Magnetic Resonance Imaging Studies
Feb 06, 2021


Abstract:Functional Magnetic Resonance Imaging (fMRI) maps cerebral activation in response to stimuli but this activation is often difficult to detect, especially in low-signal contexts and single-subject studies. Accurate activation detection can be guided by the fact that very few voxels are, in reality, truly activated and that activated voxels are spatially localized, but it is challenging to incorporate both these facts. We provide a computationally feasible and methodologically sound model-based approach, implemented in the R package MixfMRI, that bounds the a priori expected proportion of activated voxels while also incorporating spatial context. Results on simulation experiments for different levels of activation detection difficulty are uniformly encouraging. The value of the methodology in low-signal and single-subject fMRI studies is illustrated on a sports imagination experiment. Concurrently, we also extend the potential use of fMRI as a clinical tool to, for example, detect awareness and improve treatment in individual patients in persistent vegetative state, such as traumatic brain injury survivors.
Reduced-Rank Tensor-on-Tensor Regression and Tensor-variate Analysis of Variance
Dec 18, 2020


Abstract:Fitting regression models with many multivariate responses and covariates can be challenging, but such responses and covariates sometimes have tensor-variate structure. We extend the classical multivariate regression model to exploit such structure in two ways: first, we impose four types of low-rank tensor formats on the regression coefficients. Second, we model the errors using the tensor-variate normal distribution that imposes a Kronecker separable format on the covariance matrix. We obtain maximum likelihood estimators via block-relaxation algorithms and derive their asymptotic distributions. Our regression framework enables us to formulate tensor-variate analysis of variance (TANOVA) methodology. Application of our methodology in a one-way TANOVA layout enables us to identify cerebral regions significantly associated with the interaction of suicide attempters or non-attemptor ideators and positive-, negative- or death-connoting words. A separate application performs three-way TANOVA on the Labeled Faces in the Wild image database to distinguish facial characteristics related to ethnic origin, age group and gender.
An Efficient $k$-modes Algorithm for Clustering Categorical Datasets
Jun 06, 2020


Abstract:Mining clusters from datasets is an important endeavor in many applications. The $k$-means algorithm is a popular and efficient distribution-free approach for clustering numerical-valued data but can not be applied to categorical-valued observations. The $k$-modes algorithm addresses this lacuna by taking the $k$-means objective function, replacing the dissimilarity measure and using modes instead of means in the modified objective function. Unlike many other clustering algorithms, both $k$-modes and $k$-means are scalable, because they do not require calculation of all pairwise dissimilarities. We provide a fast and computationally efficient implementation of $k$-modes, OTQT, and prove that it can find superior clusterings to existing algorithms. We also examine five initialization methods and three types of $K$-selection methods, many of them novel, and all appropriate for $k$-modes. By examining the performance on real and simulated datasets, we show that simple random initialization is the best intializer, a novel $K$-selection method is more accurate than two methods adapted from $k$-means, and that the new OTQT algorithm is more accurate and almost always faster than existing algorithms.
 Add to Chrome
 Add to Firefox
 Add to Edge