Fan Dai
Democratizing planetary-scale analysis: An ultra-lightweight Earth embedding database for accurate and flexible global land monitoring
Jan 16, 2026Abstract:The rapid evolution of satellite-borne Earth Observation (EO) systems has revolutionized terrestrial monitoring, yielding petabyte-scale archives. However, the immense computational and storage requirements for global-scale analysis often preclude widespread use, hindering planetary-scale studies. To address these barriers, we present Embedded Seamless Data (ESD), an ultra-lightweight, 30-m global Earth embedding database spanning the 25-year period from 2000 to 2024. By transforming high-dimensional, multi-sensor observations from the Landsat series (5, 7, 8, and 9) and MODIS Terra into information-dense, quantized latent vectors, ESD distills essential geophysical and semantic features into a unified latent space. Utilizing the ESDNet architecture and Finite Scalar Quantization (FSQ), the dataset achieves a transformative ~340-fold reduction in data volume compared to raw archives. This compression allows the entire global land surface for a single year to be encapsulated within approximately 2.4 TB, enabling decadal-scale global analysis on standard local workstations. Rigorous validation demonstrates high reconstructive fidelity (MAE: 0.0130; RMSE: 0.0179; CC: 0.8543). By condensing the annual phenological cycle into 12 temporal steps, the embeddings provide inherent denoising and a semantically organized space that outperforms raw reflectance in land-cover classification, achieving 79.74% accuracy (vs. 76.92% for raw fusion). With robust few-shot learning capabilities and longitudinal consistency, ESD provides a versatile foundation for democratizing planetary-scale research and advancing next-generation geospatial artificial intelligence.
A Hybrid Mixture of $t$-Factor Analyzers for Clustering High-dimensional Data
Apr 29, 2025


Abstract:This paper develops a novel hybrid approach for estimating the mixture model of $t$-factor analyzers (MtFA) that employs multivariate $t$-distribution and factor model to cluster and characterize grouped data. The traditional estimation method for MtFA faces computational challenges, particularly in high-dimensional settings, where the eigendecomposition of large covariance matrices and the iterative nature of Expectation-Maximization (EM) algorithms lead to scalability issues. We propose a computational scheme that integrates a profile likelihood method into the EM framework to efficiently obtain the model parameter estimates. The effectiveness of our approach is demonstrated through simulations showcasing its superior computational efficiency compared to the existing method, while preserving clustering accuracy and resilience against outliers. Our method is applied to cluster the Gamma-ray bursts, reinforcing several claims in the literature that Gamma-ray bursts have heterogeneous subpopulations and providing characterizations of the estimated groups.
Exploratory Factor Analysis of Data on a Sphere
Nov 09, 2021
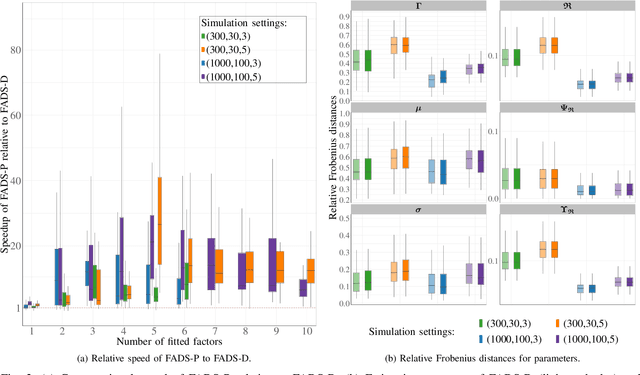
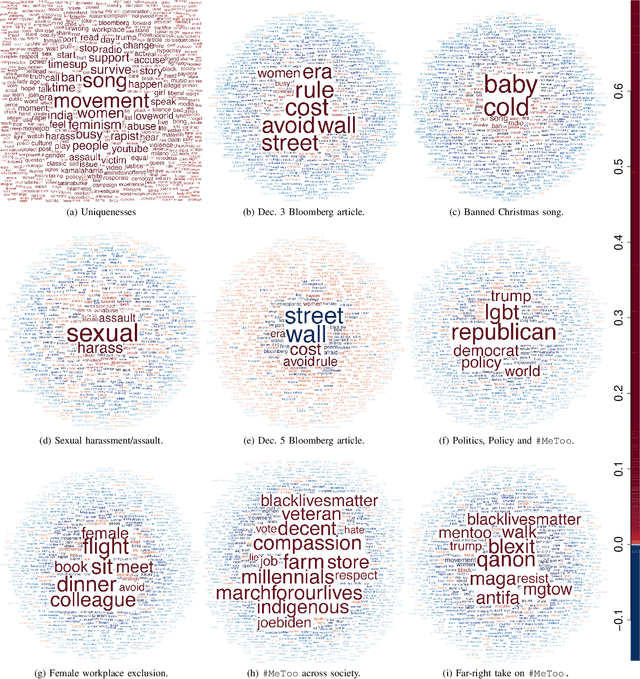
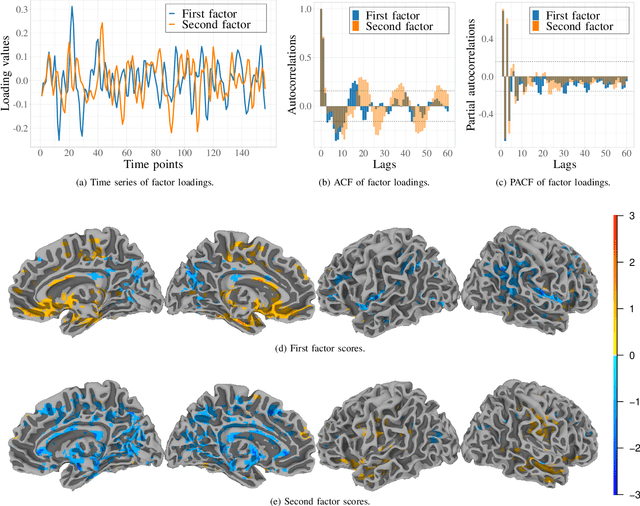
Abstract:Data on high-dimensional spheres arise frequently in many disciplines either naturally or as a consequence of preliminary processing and can have intricate dependence structure that needs to be understood. We develop exploratory factor analysis of the projected normal distribution to explain the variability in such data using a few easily interpreted latent factors. Our methodology provides maximum likelihood estimates through a novel fast alternating expectation profile conditional maximization algorithm. Results on simulation experiments on a wide range of settings are uniformly excellent. Our methodology provides interpretable and insightful results when applied to tweets with the $\#MeToo$ hashtag in early December 2018, to time-course functional Magnetic Resonance Images of the average pre-teen brain at rest, to characterize handwritten digits, and to gene expression data from cancerous cells in the Cancer Genome Atlas.
Fully Three-dimensional Radial Visualization
Oct 19, 2021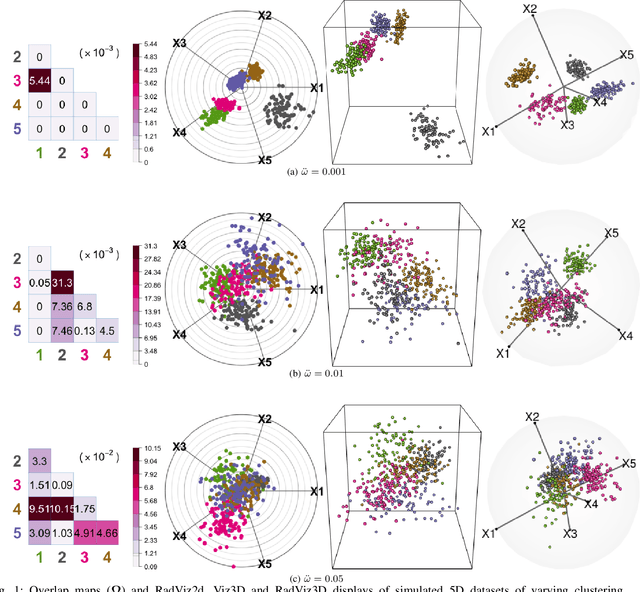


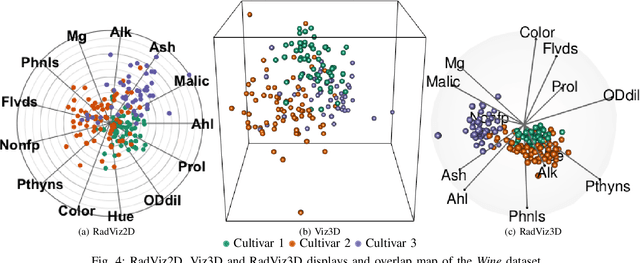
Abstract:We develop methodology for three-dimensional (3D) radial visualization (RadViz) of multidimensional datasets. The classical two-dimensional (2D) RadViz visualizes multivariate data in the 2D plane by mapping every observation to a point inside the unit circle. Our tool, RadViz3D, distributes anchor points uniformly on the 3D unit sphere. We show that this uniform distribution provides the best visualization with minimal artificial visual correlation for data with uncorrelated variables. However, anchor points can be placed exactly equi-distant from each other only for the five Platonic solids, so we provide equi-distant anchor points for these five settings, and approximately equi-distant anchor points via a Fibonacci grid for the other cases. Our methodology, implemented in the R package $radviz3d$, makes fully 3D RadViz possible and is shown to improve the ability of this nonlinear technique in more faithfully displaying simulated data as well as the crabs, olive oils and wine datasets. Additionally, because radial visualization is naturally suited for compositional data, we use RadViz3D to illustrate (i) the chemical composition of Longquan celadon ceramics and their Jingdezhen imitation over centuries, and (ii) US regional SARS-Cov-2 variants' prevalence in the Covid-19 pandemic during the summer 2021 surge of the Delta variant.
A Matrix--free Likelihood Method for Exploratory Factor Analysis of High-dimensional Gaussian Data
Jul 27, 2019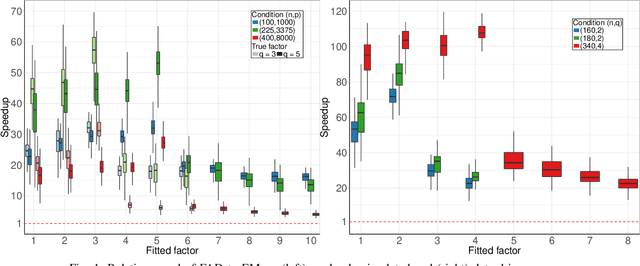


Abstract:This paper proposes a novel profile likelihood method for estimating the covariance parameters in exploratory factor analysis of high-dimensional Gaussian datasets with fewer observations than number of variables. An implicitly restarted Lanczos algorithm and a limited-memory quasi-Newton method are implemented to develop a matrix-free framework for likelihood maximization. Simulation results show that our method is substantially faster than the expectation-maximization solution without sacrificing accuracy. Our method is applied to fit factor models on data from suicide attempters, suicide ideators and a control group.
Three-dimensional Radial Visualization of High-dimensional Continuous or Discrete Data
Apr 06, 2019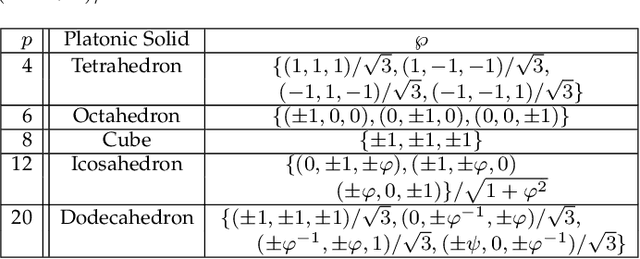


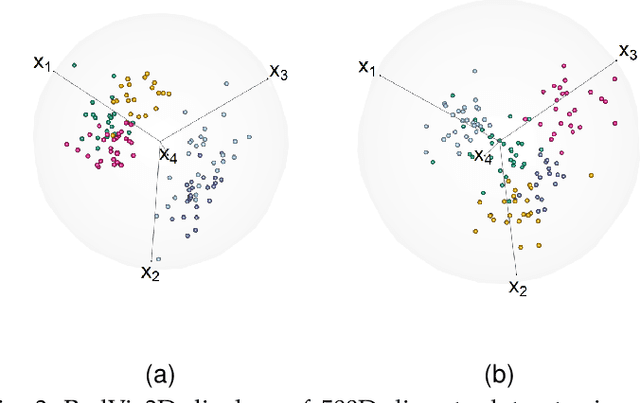
Abstract:This paper develops methodology for 3D radial visualization of high-dimensional datasets. Our display engine is called RadViz3D and extends the classic RadViz that visualizes multivariate data in the 2D plane by mapping every record to a point inside the unit circle. The classic RadViz display has equally-spaced anchor points on the unit circle, with each of them associated with an attribute or feature of the dataset. RadViz3D obtains equi-spaced anchor points exactly for the five Platonic solids and approximately for the other cases via a Fibonacci grid. We show that distributing anchor points at least approximately uniformly on the 3D unit sphere provides a better visualization than in 2D. We also propose a Max-Ratio Projection (MRP) method that utilizes the group information in high dimensions to provide distinctive lower-dimensional projections that are then displayed using Radviz3D. Our methodology is extended to datasets with discrete and mixed features where a generalized distributional transform is used in conjuction with copula models before applying MRP and RadViz3D visualization.
 Add to Chrome
 Add to Firefox
 Add to Edge