Raheleh Kafieh
Thickness Mapping of Eleven Retinal Layers in Normal Eyes Using Spectral Domain Optical Coherence Tomography
Dec 11, 2013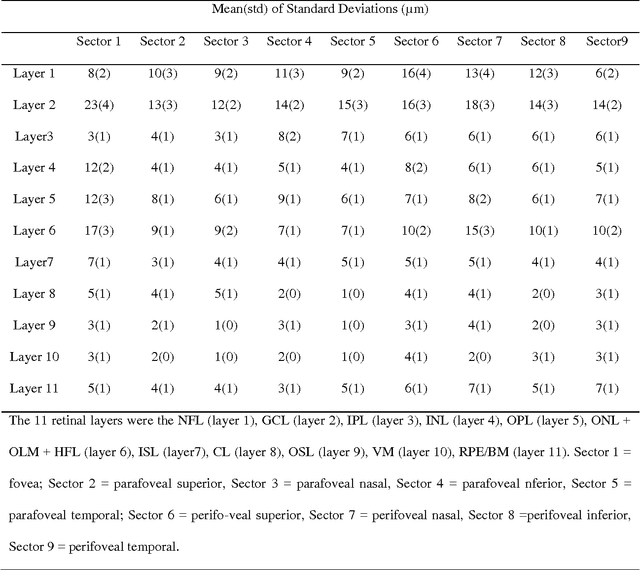
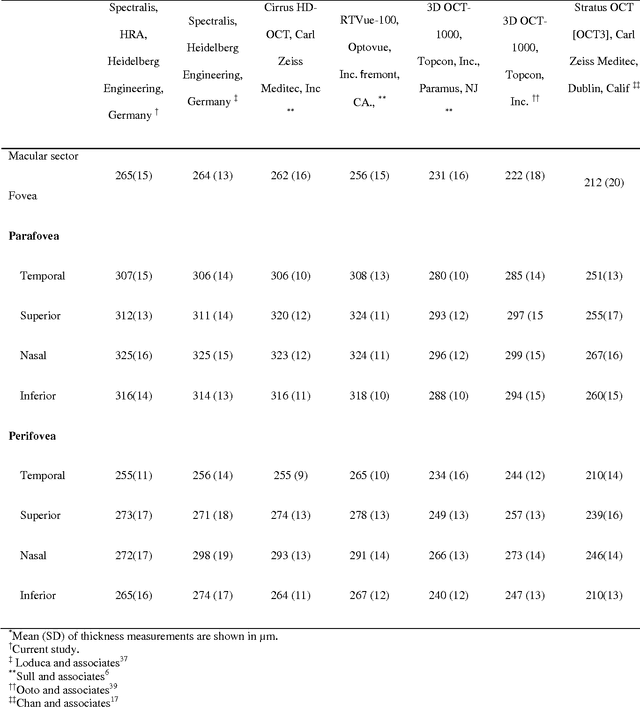
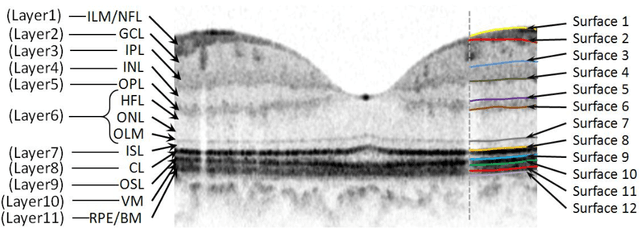
Abstract:Purpose. This study was conducted to determine the thickness map of eleven retinal layers in normal subjects by spectral domain optical coherence tomography (SD-OCT) and evaluate their association with sex and age. Methods. Mean regional retinal thickness of 11 retinal layers were obtained by automatic three-dimensional diffusion-map-based method in 112 normal eyes of 76 Iranian subjects. Results. The thickness map of central foveal area in layer 1, 3, and 4 displayed the minimum thickness (P<0.005 for all). Maximum thickness was observed in nasal to the fovea of layer 1 (P<0.001) and in a circular pattern in the parafoveal retinal area of layers 2, 3 and 4 and in central foveal area of layer 6 (P<0.001). Temporal and inferior quadrants of the total retinal thickness and most of other quadrants of layer 1 were significantly greater in the men than in the women. Surrounding eight sectors of total retinal thickness and a limited number of sectors in layer 1 and 4 significantly correlated with age. Conclusion. SD-OCT demonstrated the three-dimensional thickness distribution of retinal layers in normal eyes. Thickness of layers varied with sex and age and in different sectors. These variables should be considered while evaluating macular thickness.
Intra-Retinal Layer Segmentation of 3D Optical Coherence Tomography Using Coarse Grained Diffusion Map
Oct 08, 2012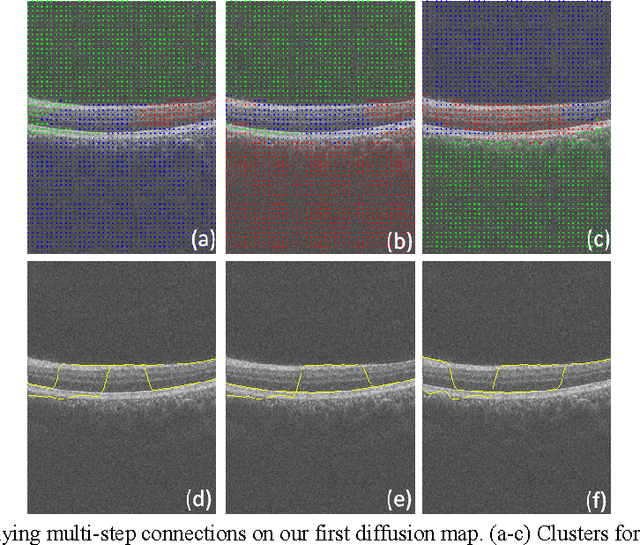
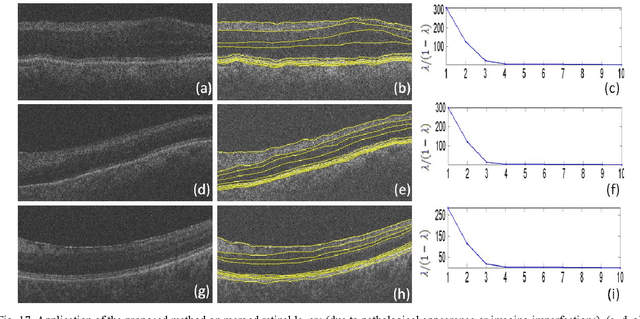
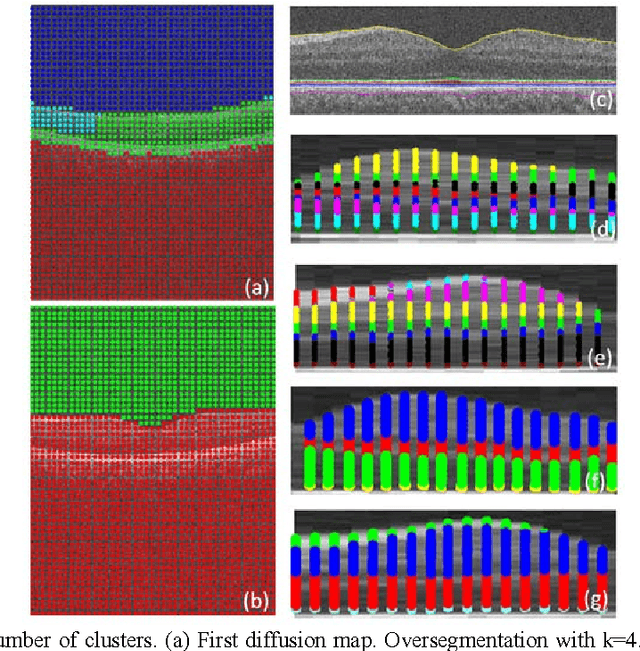

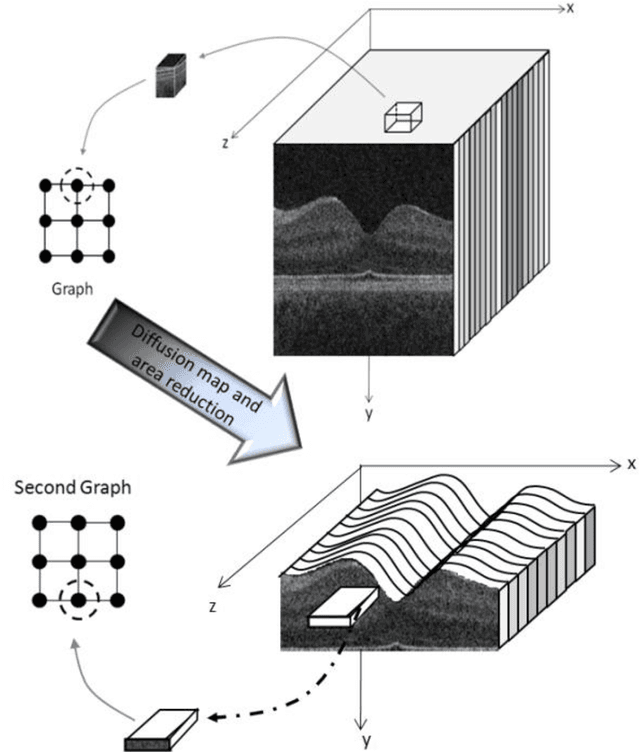
Abstract:Optical coherence tomography (OCT) is a powerful and noninvasive method for retinal imaging. In this paper, we introduce a fast segmentation method based on a new variant of spectral graph theory named diffusion maps. The research is performed on spectral domain (SD) OCT images depicting macular and optic nerve head appearance. The presented approach does not require edge-based image information and relies on regional image texture. Consequently, the proposed method demonstrates robustness in situations of low image contrast or poor layer-to-layer image gradients. Diffusion mapping is applied to 2D and 3D OCT datasets composed of two steps, one for partitioning the data into important and less important sections, and another one for localization of internal layers.In the first step, the pixels/voxels are grouped in rectangular/cubic sets to form a graph node.The weights of a graph are calculated based on geometric distances between pixels/voxels and differences of their mean intensity.The first diffusion map clusters the data into three parts, the second of which is the area of interest. The other two sections are eliminated from the remaining calculations. In the second step, the remaining area is subjected to another diffusion map assessment and the internal layers are localized based on their textural similarities.The proposed method was tested on 23 datasets from two patient groups (glaucoma and normals). The mean unsigned border positioning errors(mean - SD) was 8.52 - 3.13 and 7.56 - 2.95 micrometer for the 2D and 3D methods, respectively.
 Add to Chrome
 Add to Firefox
 Add to Edge