Orion Reblitz-Richardson
A Tour of Visualization Techniques for Computer Vision Datasets
Apr 19, 2022

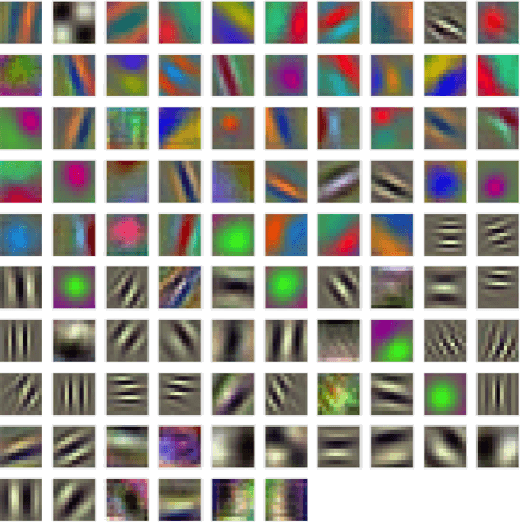
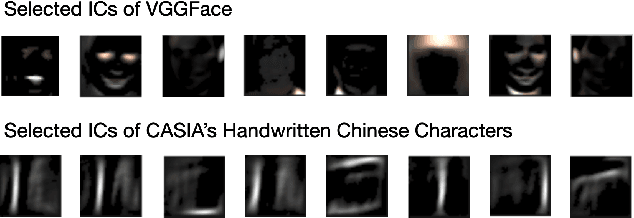
Abstract:We survey a number of data visualization techniques for analyzing Computer Vision (CV) datasets. These techniques help us understand properties and latent patterns in such data, by applying dataset-level analysis. We present various examples of how such analysis helps predict the potential impact of the dataset properties on CV models and informs appropriate mitigation of their shortcomings. Finally, we explore avenues for further visualization techniques of different modalities of CV datasets as well as ones that are tailored to support specific CV tasks and analysis needs.
Investigating sanity checks for saliency maps with image and text classification
Jun 08, 2021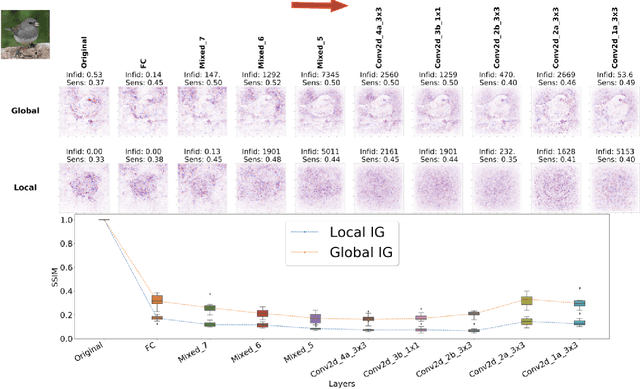

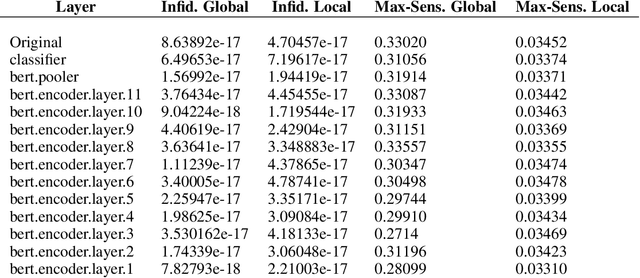
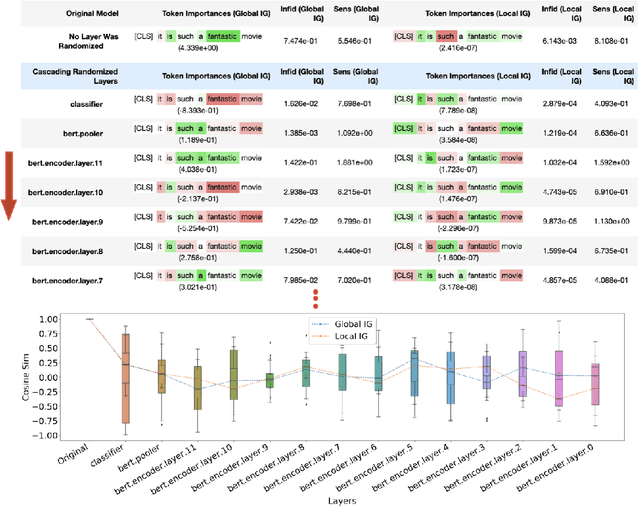
Abstract:Saliency maps have shown to be both useful and misleading for explaining model predictions especially in the context of images. In this paper, we perform sanity checks for text modality and show that the conclusions made for image do not directly transfer to text. We also analyze the effects of the input multiplier in certain saliency maps using similarity scores, max-sensitivity and infidelity evaluation metrics. Our observations reveal that the input multiplier carries input's structural patterns in explanation maps, thus leading to similar results regardless of the choice of model parameters. We also show that the smoothness of a Neural Network (NN) function can affect the quality of saliency-based explanations. Our investigations reveal that replacing ReLUs with Softplus and MaxPool with smoother variants such as LogSumExp (LSE) can lead to explanations that are more reliable based on the infidelity evaluation metric.
Investigating Saturation Effects in Integrated Gradients
Oct 23, 2020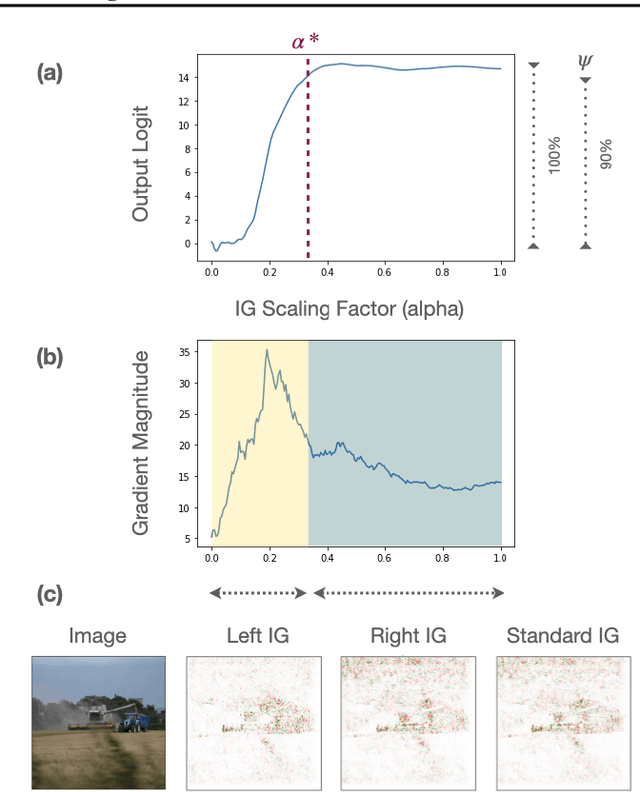
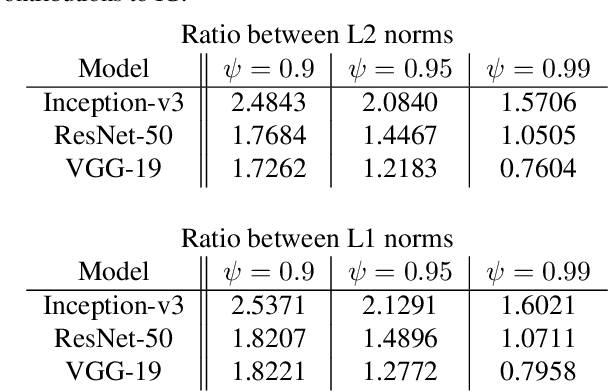
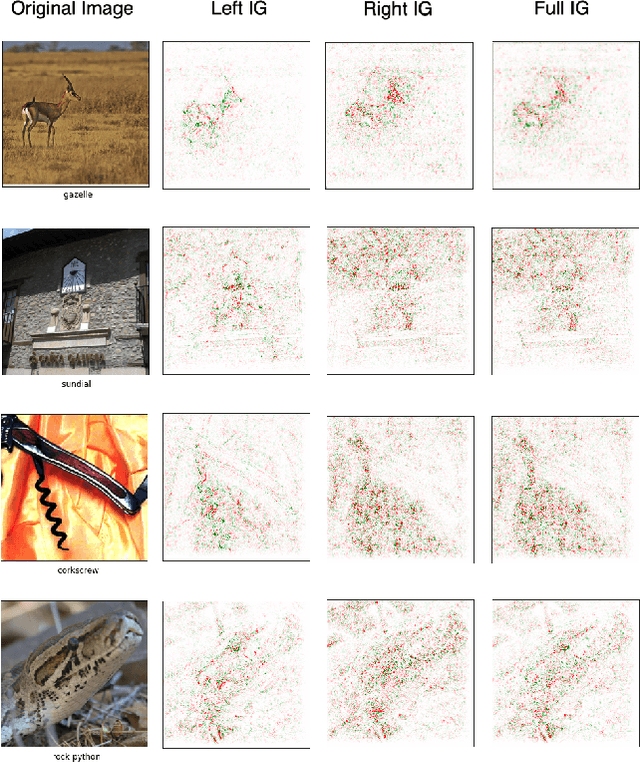

Abstract:Integrated Gradients has become a popular method for post-hoc model interpretability. De-spite its popularity, the composition and relative impact of different regions of the integral path are not well understood. We explore these effects and find that gradients in saturated regions of this path, where model output changes minimally, contribute disproportionately to the computed attribution. We propose a variant of IntegratedGradients which primarily captures gradients in unsaturated regions and evaluate this method on ImageNet classification networks. We find that this attribution technique shows higher model faithfulness and lower sensitivity to noise com-pared with standard Integrated Gradients. A note-book illustrating our computations and results is available at https://github.com/vivekmig/captum-1/tree/ExpandedIG.
Mind the Pad -- CNNs can Develop Blind Spots
Oct 05, 2020


Abstract:We show how feature maps in convolutional networks are susceptible to spatial bias. Due to a combination of architectural choices, the activation at certain locations is systematically elevated or weakened. The major source of this bias is the padding mechanism. Depending on several aspects of convolution arithmetic, this mechanism can apply the padding unevenly, leading to asymmetries in the learned weights. We demonstrate how such bias can be detrimental to certain tasks such as small object detection: the activation is suppressed if the stimulus lies in the impacted area, leading to blind spots and misdetection. We propose solutions to mitigate spatial bias and demonstrate how they can improve model accuracy.
Captum: A unified and generic model interpretability library for PyTorch
Sep 16, 2020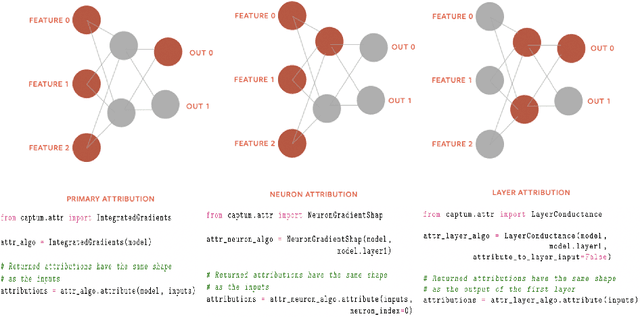

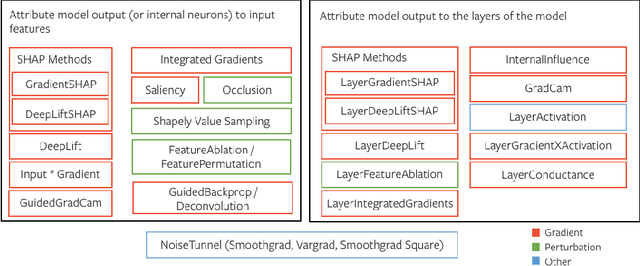

Abstract:In this paper we introduce a novel, unified, open-source model interpretability library for PyTorch [12]. The library contains generic implementations of a number of gradient and perturbation-based attribution algorithms, also known as feature, neuron and layer importance algorithms, as well as a set of evaluation metrics for these algorithms. It can be used for both classification and non-classification models including graph-structured models built on Neural Networks (NN). In this paper we give a high-level overview of supported attribution algorithms and show how to perform memory-efficient and scalable computations. We emphasize that the three main characteristics of the library are multimodality, extensibility and ease of use. Multimodality supports different modality of inputs such as image, text, audio or video. Extensibility allows adding new algorithms and features. The library is also designed for easy understanding and use. Besides, we also introduce an interactive visualization tool called Captum Insights that is built on top of Captum library and allows sample-based model debugging and visualization using feature importance metrics.
 Add to Chrome
 Add to Firefox
 Add to Edge