Mayukha Pal
SMART SLM: Structured Memory and Reasoning Transformer, A Small Language Model for Accurate Document Assistance
Dec 24, 2025Abstract:The user of Engineering Manuals (EM) finds it difficult to read EM s because they are long, have a dense format which includes written documents, step by step procedures, and standard parameter lists for engineering equipment. Off the shelf transformers, especially compact ones, treat this material as a flat stream of tokens. This approach leads to confident but incorrect numeric answers and forces the models to memorize separate facts inefficiently. SMART (Structured Memory and Reasoning Transformer) offers a different and practical solution to the above problem. SMART structures its processing by using a hierarchical approach, and is based upon three main job categories (1) A syntax-aware Fact Extractor (Grammarian) Tree LSTM which extracts facts as subject relation object relations from EM sentences (2) A compact indexed memory MANN (Memory Augmented Neural Network) that indexes these Rational Subject Relation Objects as 384 dimensional vectors that are associated with the source of the information, and (3) A 6 layer Transformer that learns to fuse the previously retrieved facts into its generated response. The entire SMART model utilizes 45.51M parameters, which is 64% less than GPT-2 (124M) and 69% less than BERT (133M), and it achieves a 21.3% higher accuracy than GPT-2, indicating that SMART fits the data better with the least amount of processing requirements. SMART employs dual modes of inference an indexed fast path for known documents (sub-second answer times) and an indexed dynamic path assisted by RAGs for new uploads (FAISS Top 20 results with memory severed at 64 slots). In real world deployment, this framework leads to more well supported results with reduced hallucinations than comparable small transformer models.
Game-Theoretic Resilience Framework for Cyber-Physical Microgrids using Multi-Agent Reinforcement Learning
Sep 10, 2025Abstract:The increasing reliance on cyber physical infrastructure in modern power systems has amplified the risk of targeted cyber attacks, necessitating robust and adaptive resilience strategies. This paper presents a mathematically rigorous game theoretic framework to evaluate and enhance microgrid resilience using a combination of quantitative resilience metrics Load Served Ratio LSR, Critical Load Resilience CLR, Topological Survivability Score TSS, and DER Resilience Score DRS. These are integrated into a unified payoff matrix using the Analytic Hierarchy Process AHP to assess attack defense interactions. The framework is formalized as a finite horizon Markov Decision Process MDP with formal convergence guarantees and computational complexity bounds. Three case studies are developed 1. static attacks analyzed via Nash equilibrium, 2. severe attacks incorporating high impact strategies, and 3. adaptive attacks using Stackelberg games, regret matching, softmax heuristics, and Multi Agent Q Learning. Rigorous theoretical analysis provides convergence proofs with explicit rates , PAC learning sample complexity bounds, and computational complexity analysis. The framework is tested on an enhanced IEEE 33bus distribution system with DERs and control switches, demonstrating the effectiveness of adaptive and strategic defenses in improving cyber physical resilience with statistically significant improvements of 18.7% 2.1% over static approaches.
Agentic-AI based Mathematical Framework for Commercialization of Energy Resilience in Electrical Distribution System Planning and Operation
Aug 06, 2025Abstract:The increasing vulnerability of electrical distribution systems to extreme weather events and cyber threats necessitates the development of economically viable frameworks for resilience enhancement. While existing approaches focus primarily on technical resilience metrics and enhancement strategies, there remains a significant gap in establishing market-driven mechanisms that can effectively commercialize resilience features while optimizing their deployment through intelligent decision-making. Moreover, traditional optimization approaches for distribution network reconfiguration often fail to dynamically adapt to both normal and emergency conditions. This paper introduces a novel framework integrating dual-agent Proximal Policy Optimization (PPO) with market-based mechanisms, achieving an average resilience score of 0.85 0.08 over 10 test episodes. The proposed architecture leverages a dual-agent PPO scheme, where a strategic agent selects optimal DER-driven switching configurations, while a tactical agent fine-tunes individual switch states and grid preferences under budget and weather constraints. These agents interact within a custom-built dynamic simulation environment that models stochastic calamity events, budget limits, and resilience-cost trade-offs. A comprehensive reward function is designed that balances resilience enhancement objectives with market profitability (with up to 200x reward incentives, resulting in 85% of actions during calamity steps selecting configurations with 4 DERs), incorporating factors such as load recovery speed, system robustness, and customer satisfaction. Over 10 test episodes, the framework achieved a benefit-cost ratio of 0.12 0.01, demonstrating sustainable market incentives for resilience investment. This framework creates sustainable market incentives
Lightweight Transformer-Driven Segmentation of Hotspots and Snail Trails in Solar PV Thermal Imagery
Jul 28, 2025Abstract:Accurate detection of defects such as hotspots and snail trails in photovoltaic modules is essential for maintaining energy efficiency and system reliablility. This work presents a supervised deep learning framework for segmenting thermal infrared images of PV panels, using a dataset of 277 aerial thermographic images captured by zenmuse XT infrared camera mounted on a DJI Matrice 100 drone. The preprocessing pipeline includes image resizing, CLAHE based contrast enhancement, denoising, and normalisation. A lightweight semantic segmentation model based on SegFormer is developed, featuring a customised Transformwer encoder and streamlined decoder, and fine-tuned on annotated images with manually labeled defect regions. To evaluate performance, we benchmark our model against U-Net, DeepLabV3, PSPNet, and Mask2Former using consistent preprocessing and augmentation. Evaluation metrices includes per-class Dice score, F1-score, Cohen's kappa, mean IoU, and pixel accuracy. The SegFormer-based model outperforms baselines in accuracy and efficiency, particularly for segmenting small and irregular defects. Its lightweight design real-time deployment on edge devices and seamless integration with drone-based systems for automated inspection of large-scale solar farms.
Methodology for Detecting Energy Anomalies due to Multi-Replay Attacks on Electric Vehicle Charging Infrastructure
Apr 01, 2025Abstract:The increasing deployment of Electric Vehicle Charging Infrastructures (EVCIs) introduces cybersecurity challenges, particularly due to inherent vulnerabilities, making them susceptible to cyberattacks. The vulnerable points in EVCI are charging ports, which serve as the links between the EVs and the EVCI as they transfer the data along with the power. Data spoofing attacks targeting these ports can compromise security, reliability, and overall system performance by introducing anomalies in operational data. An efficient method for identifying the charging port current magnitude variations is presented in this research. The MATLAB/SIMULINK environment simulates an EVCI system for various data generating scenarios. A Temporal Convolution Network - Autoencoder (TCN-AE) model is used in training the multivariate time series data of EVCI and reconstructing it. The abnormalities in data are that various charging port current magnitudes are replaced with their respective data of different durations, thus enabling the replay attack scenarios. To detect anomalies, the error between the original and reconstructed data is computed, and these error values are used for detecting the anomalies. With the help of the mean vector and covariance matrices of the errors, the anomaly score is computed in the form of Mahalanobis distance. The threshold is obtained from the short sub-sequence of the errors and optimized for the whole time series data. The obtained optimal threshold is compared with the anomaly score to detect the anomaly. The model demonstrates robust performance in data reconstruction by identifying anomalies with an accuracy of 99.64%, to enhance the reliability and security in operations of EVCI.
Integrated Optimization and Game Theory Framework for Fair Cost Allocation in Community Microgrids
Feb 13, 2025Abstract:Fair cost allocation in community microgrids remains a significant challenge due to the complex interactions between multiple participants with varying load profiles, distributed energy resources, and storage systems. Traditional cost allocation methods often fail to adequately address the dynamic nature of participant contributions and benefits, leading to inequitable distribution of costs and reduced participant satisfaction. This paper presents a novel framework integrating multi-objective optimization with cooperative game theory for fair and efficient microgrid operation and cost allocation. The proposed approach combines mixed-integer linear programming for optimal resource dispatch with Shapley value analysis for equitable benefit distribution, ensuring both system efficiency and participant satisfaction. The framework was validated using real-world data across six distinct operational scenarios, demonstrating significant improvements in both technical and economic performance. Results show peak demand reductions ranging from 7.8% to 62.6%, solar utilization rates reaching 114.8% through effective storage integration, and cooperative gains of up to $1,801.01 per day. The Shapley value-based allocation achieved balanced benefit-cost distributions, with net positions ranging from -16.0% to +14.2% across different load categories, ensuring sustainable participant cooperation.
Demand Response Optimization MILP Framework for Microgrids with DERs
Feb 12, 2025


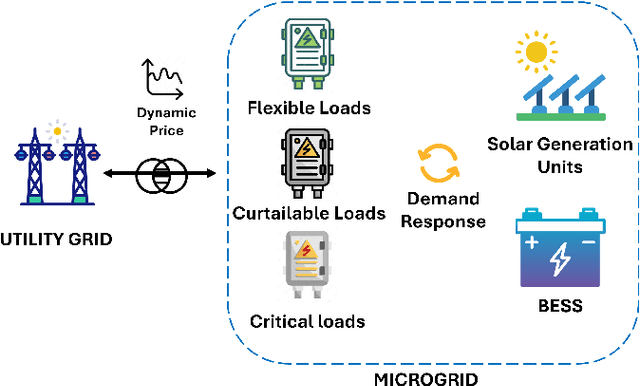
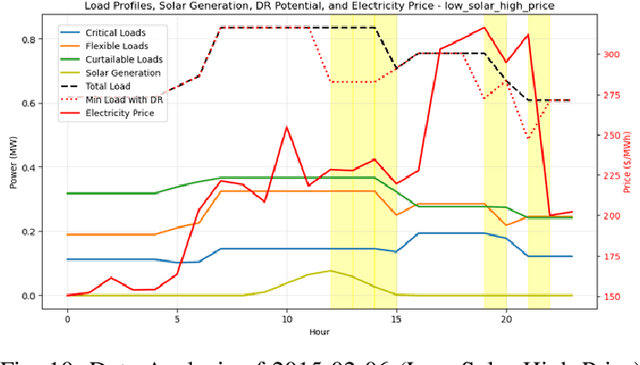
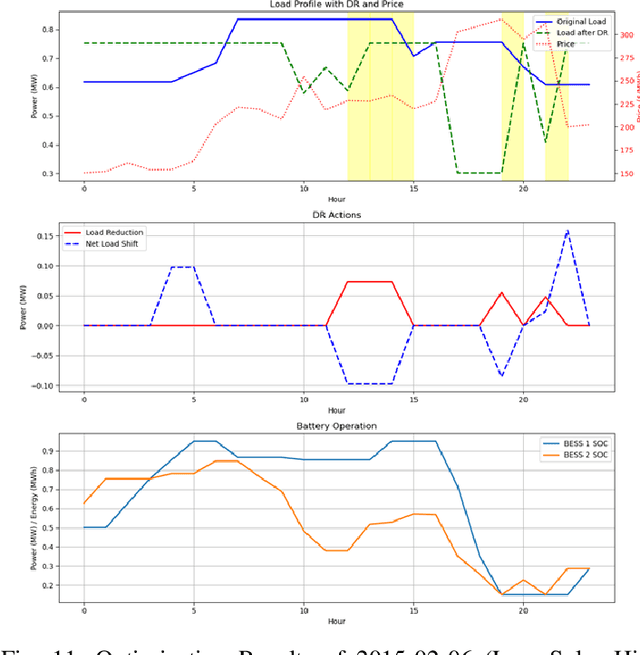
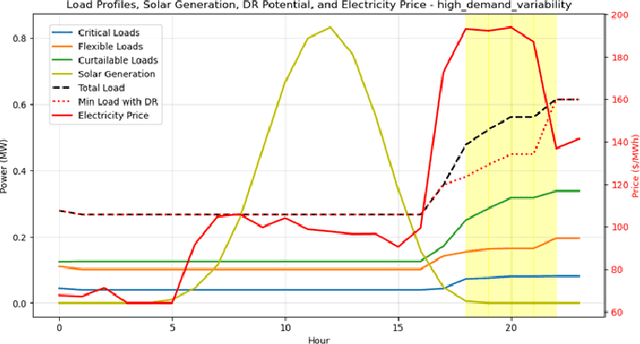
Abstract:The integration of renewable energy sources in microgrids introduces significant operational challenges due to their intermittent nature and the mismatch between generation and demand patterns. Effective demand response (DR) strategies are crucial for maintaining system stability and economic efficiency, particularly in microgrids with high renewable penetration. This paper presents a comprehensive mixed-integer linear programming (MILP) framework for optimizing DR operations in a microgrid with solar generation and battery storage systems. The framework incorporates load classification, dynamic price thresholding, and multi-period coordination for optimal DR event scheduling. Analysis across seven distinct operational scenarios demonstrates consistent peak load reduction of 10\% while achieving energy cost savings ranging from 13.1\% to 38.0\%. The highest performance was observed in scenarios with high solar generation, where the framework achieved 38.0\% energy cost reduction through optimal coordination of renewable resources and DR actions. The results validate the framework's effectiveness in managing diverse operational challenges while maintaining system stability and economic efficiency.
A Comprehensive Metric for Resilience Evaluation of Power Distribution Systems under Cyber Attacks
Jan 21, 2025


Abstract:Power distribution systems (PDS) serve as the backbone of our modern society, ensuring electricity reaches homes, businesses, and critical infrastructure. However, the increasing digitization and interconnectivity of these systems have exposed them to cyber threats. This study presents a comprehensive approach to evaluate and enhance the resilience of PDS under cyber attacks using the Common Vulnerability Scoring System (CVSS) and complex network parameters. By systematically assessing vulnerabilities and computing resilience once critical CVSS thresholds are reached, this work identifies key resilience metrics including the critical loads service requirements. The proposed methodology improves system resilience through strategic tie-line switching, which is validated on the modified IEEE 33-bus system. Four case studies are conducted, illustrating the performance of the proposed methodology under various cyber attack scenarios. The results demonstrate the effectiveness of the approach in quantifying and enhancing resilience, offering a valuable tool for PDS operators to mitigate risks and ensure continuous service delivery to critical loads during the exploitation of cyber threats.
Regression Based Anomaly Detection in Electric Vehicle State of Charge Fluctuations Through Analysis of EVCI Data
Jan 03, 2024Abstract:With the increase in the number of electric vehicles (EV), there is a need for the development of the EV charging infrastructure (EVCI) to facilitate fast charging, thereby mitigating the EV congestion at charging stations. The role of the public charging station depot is to charge the vehicle, prioritizing the achievement of the desired state of charge (SoC) value for the EV battery or charging till the departure of the EV, whichever occurs first. The integration of cyber and physical components within EVCI defines it as a cyber physical power system (CPPS), increasing its vulnerability to diverse cyber attacks. When an EV interfaces with the EVCI, mutual exchange of data takes place via various communication protocols like the Open Charge Point Protocol (OCPP), and IEC 61850. Unauthorized access to this data by intruders leads to cyber attacks, potentially resulting in consequences like energy theft, and revenue loss. These scenarios may cause the EVCI to incur higher charges than the actual energy consumed or the EV owners to remit payments that do not correspond adequately to the amount of energy they have consumed. This article proposes an EVCI architecture connected to the utility grid and uses the EVCI data to identify the anomalies or outliers present in the EV transmitted data, particularly focusing on SoC irregularities.
DynamoPMU: A Physics Informed Anomaly Detection and Prediction Methodology using non-linear dynamics from $μ$PMU Measurement Data
Mar 31, 2023Abstract:The expansion in technology and attainability of a large number of sensors has led to a huge amount of real-time streaming data. The real-time data in the electrical distribution system is collected through distribution-level phasor measurement units referred to as $\mu$PMU which report high-resolution phasor measurements comprising various event signatures which provide situational awareness and enable a level of visibility into the distribution system. These events are infrequent, unschedule, and uncertain; it is a challenge to scrutinize, detect and predict the occurrence of such events. For electrical distribution systems, it is challenging to explicitly identify evolution functions that describe the complex, non-linear, and non-stationary signature patterns of events. In this paper, we seek to address this problem by developing a physics dynamics-based approach to detect anomalies in the $\mu$PMU streaming data and simultaneously predict the events using governing equations. We propose a data-driven approach based on the Hankel alternative view of the Koopman (HAVOK) operator, called DynamoPMU, to analyze the underlying dynamics of the distribution system by representing them in a linear intrinsic space. The key technical idea is that the proposed method separates out the linear dynamical behaviour pattern and intermittent forcing (anomalous events) in sequential data which turns out to be very useful for anomaly detection and simultaneous data prediction. We demonstrate the efficacy of our proposed framework through analysis of real $\mu$PMU data taken from the LBNL distribution grid. DynamoPMU is suitable for real-time event detection as well as prediction in an unsupervised way and adapts to varying statistics.
 Add to Chrome
 Add to Firefox
 Add to Edge