Guojin He
From Model-driven to Data-driven: A Survey on Active Deep Learning
Jan 25, 2021


Abstract:Which samples should be labelled in a large data set is one of the most important problems for trainingof deep learning. So far, a variety of active sample selection strategies related to deep learning havebeen proposed in many literatures. We defined them as Active Deep Learning (ADL) only if theirpredictor is deep model, where the basic learner is called as predictor and the labeling schemes iscalled selector. In this survey, three fundamental factors in selector designation were summarized. Wecategory ADL into model-driven ADL and data-driven ADL, by whether its selector is model-drivenor data-driven. The different characteristics of the two major type of ADL were addressed in indetail respectively. Furthermore, different sub-classes of data-driven and model-driven ADL are alsosummarized and discussed emphatically. The advantages and disadvantages between data-driven ADLand model-driven ADL are thoroughly analyzed. We pointed out that, with the development of deeplearning, the selector in ADL also is experiencing the stage from model-driven to data-driven. Finally,we make discussion on ADL about its uncertainty, explanatory, foundations of cognitive science etc.and survey on the trend of ADL from model-driven to data-driven.
30m resolution Global Annual Burned Area Mapping based on Landsat images and Google Earth Engine
May 07, 2018


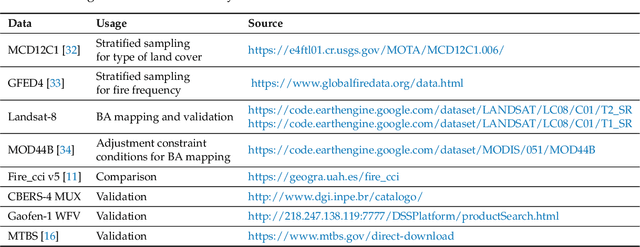
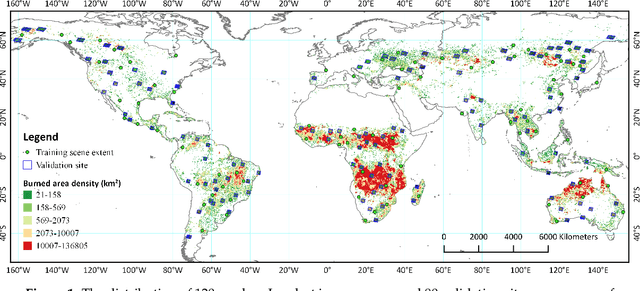
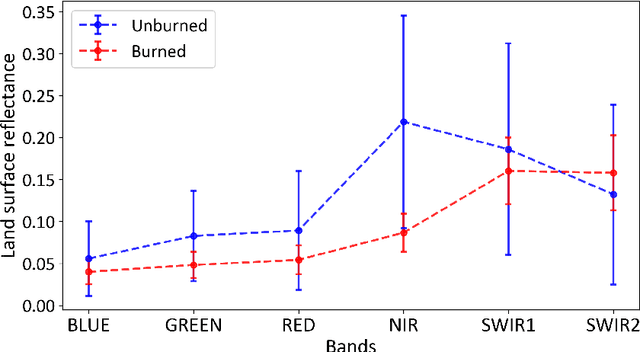
Abstract:Heretofore, global burned area (BA) products are only available at coarse spatial resolution, since most of the current global BA products are produced with the help of active fire detection or dense time-series change analysis, which requires very high temporal resolution. In this study, however, we focus on automated global burned area mapping approach based on Landsat images. By utilizing the huge catalog of satellite imagery as well as the high-performance computing capacity of Google Earth Engine, we proposed an automated pipeline for generating 30-meter resolution global-scale annual burned area map from time-series of Landsat images, and a novel 30-meter resolution global annual burned area map of 2015 (GABAM 2015) is released. GABAM 2015 consists of spatial extent of fires that occurred during 2015 and not of fires that occurred in previous years. Cross-comparison with recent Fire_cci version 5.0 BA product found a similar spatial distribution and a strong correlation ($R^2=0.74$) between the burned areas from the two products, although differences were found in specific land cover categories (particularly in agriculture land). Preliminary global validation showed the commission and omission error of GABAM 2015 are 13.17% and 30.13%, respectively.
 Add to Chrome
 Add to Firefox
 Add to Edge