Dylan Grosz
Automatic Detection of Sexist Statements Commonly Used at the Workplace
Jul 08, 2020
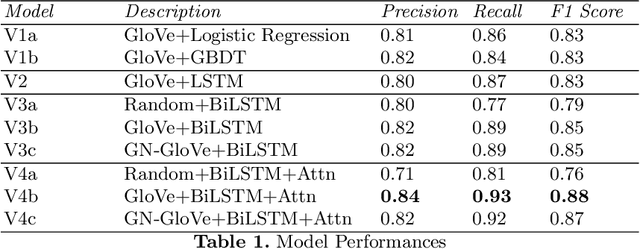
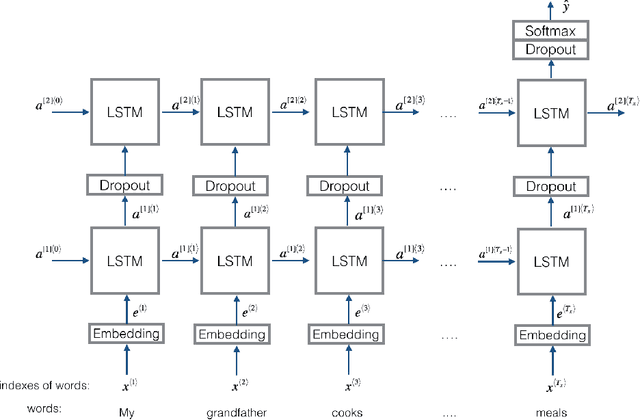
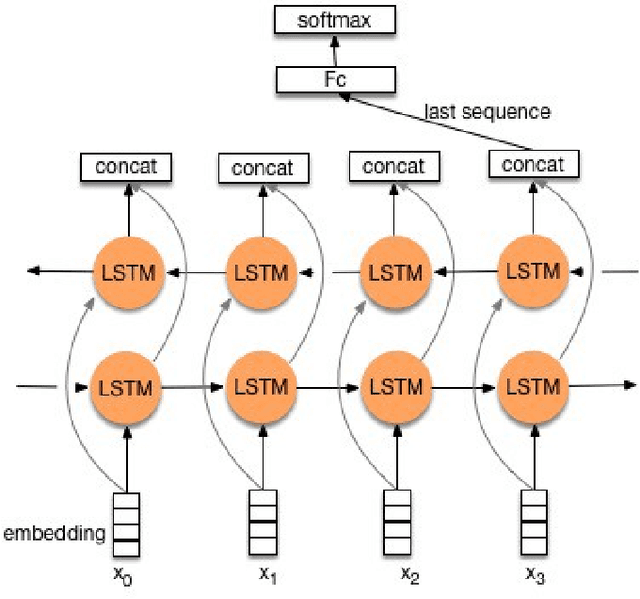
Abstract:Detecting hate speech in the workplace is a unique classification task, as the underlying social context implies a subtler version of conventional hate speech. Applications regarding a state-of the-art workplace sexism detection model include aids for Human Resources departments, AI chatbots and sentiment analysis. Most existing hate speech detection methods, although robust and accurate, focus on hate speech found on social media, specifically Twitter. The context of social media is much more anonymous than the workplace, therefore it tends to lend itself to more aggressive and "hostile" versions of sexism. Therefore, datasets with large amounts of "hostile" sexism have a slightly easier detection task since "hostile" sexist statements can hinge on a couple words that, regardless of context, tip the model off that a statement is sexist. In this paper we present a dataset of sexist statements that are more likely to be said in the workplace as well as a deep learning model that can achieve state-of-the art results. Previous research has created state-of-the-art models to distinguish "hostile" and "benevolent" sexism based simply on aggregated Twitter data. Our deep learning methods, initialized with GloVe or random word embeddings, use LSTMs with attention mechanisms to outperform those models on a more diverse, filtered dataset that is more targeted towards workplace sexism, leading to an F1 score of 0.88.
Predicting Livelihood Indicators from Crowdsourced Street Level Images
Jun 27, 2020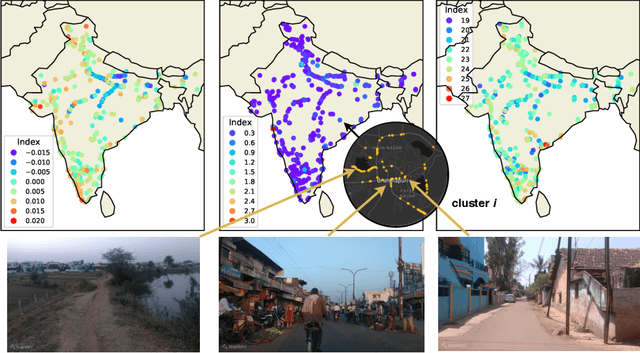
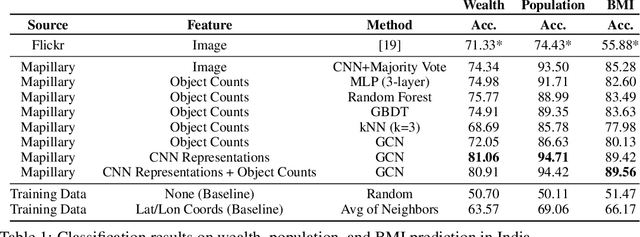
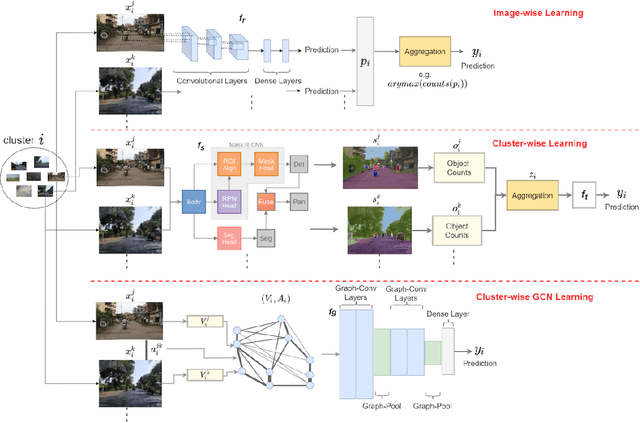

Abstract:Major decisions from governments and other large organizations rely on measurements of the populace's well-being, but making such measurements at a broad scale is expensive and thus infrequent in much of the developing world. We propose an inexpensive, scalable, and interpretable approach to predict key livelihood indicators from public crowd-sourced street-level imagery. Such imagery can be cheaply collected and more frequently updated compared to traditional surveying methods, while containing plausibly relevant information for a range of livelihood indicators. We propose two approaches to learn from the street-level imagery. First method creates multihousehold cluster representations by detecting informative objects and the second method uses a graph-based approach that leverages the inherent structure between images. By visualizing what features are important to a model and how they are used, we can help end-user organizations understand the models and offer an alternate approach for index estimation that uses cheaply obtained roadway features. By comparing our results against ground data collected in nationally-representative household surveys, we show our approach can be used to accurately predict indicators of poverty, population, and health across India.
 Add to Chrome
 Add to Firefox
 Add to Edge