Duyun Chen
Fine-Grained Car Detection for Visual Census Estimation
Sep 07, 2017


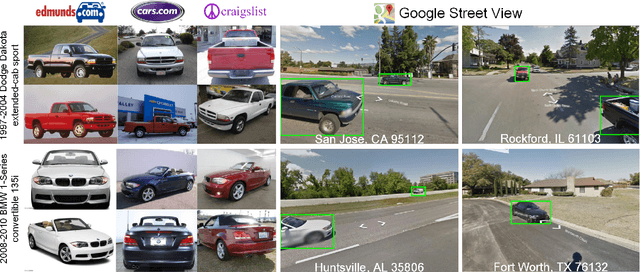
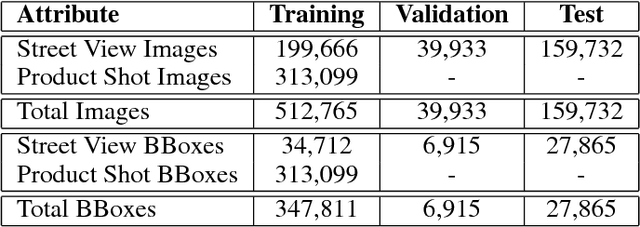
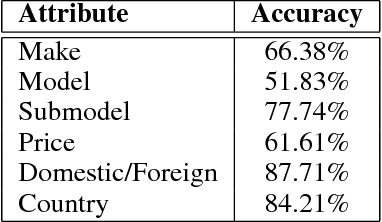
Abstract:Targeted socioeconomic policies require an accurate understanding of a country's demographic makeup. To that end, the United States spends more than 1 billion dollars a year gathering census data such as race, gender, education, occupation and unemployment rates. Compared to the traditional method of collecting surveys across many years which is costly and labor intensive, data-driven, machine learning driven approaches are cheaper and faster--with the potential ability to detect trends in close to real time. In this work, we leverage the ubiquity of Google Street View images and develop a computer vision pipeline to predict income, per capita carbon emission, crime rates and other city attributes from a single source of publicly available visual data. We first detect cars in 50 million images across 200 of the largest US cities and train a model to predict demographic attributes using the detected cars. To facilitate our work, we have collected the largest and most challenging fine-grained dataset reported to date consisting of over 2600 classes of cars comprised of images from Google Street View and other web sources, classified by car experts to account for even the most subtle of visual differences. We use this data to construct the largest scale fine-grained detection system reported to date. Our prediction results correlate well with ground truth income data (r=0.82), Massachusetts department of vehicle registration, and sources investigating crime rates, income segregation, per capita carbon emission, and other market research. Finally, we learn interesting relationships between cars and neighborhoods allowing us to perform the first large scale sociological analysis of cities using computer vision techniques.
Using Deep Learning and Google Street View to Estimate the Demographic Makeup of the US
Mar 02, 2017


Abstract:The United States spends more than $1B each year on initiatives such as the American Community Survey (ACS), a labor-intensive door-to-door study that measures statistics relating to race, gender, education, occupation, unemployment, and other demographic factors. Although a comprehensive source of data, the lag between demographic changes and their appearance in the ACS can exceed half a decade. As digital imagery becomes ubiquitous and machine vision techniques improve, automated data analysis may provide a cheaper and faster alternative. Here, we present a method that determines socioeconomic trends from 50 million images of street scenes, gathered in 200 American cities by Google Street View cars. Using deep learning-based computer vision techniques, we determined the make, model, and year of all motor vehicles encountered in particular neighborhoods. Data from this census of motor vehicles, which enumerated 22M automobiles in total (8% of all automobiles in the US), was used to accurately estimate income, race, education, and voting patterns, with single-precinct resolution. (The average US precinct contains approximately 1000 people.) The resulting associations are surprisingly simple and powerful. For instance, if the number of sedans encountered during a 15-minute drive through a city is higher than the number of pickup trucks, the city is likely to vote for a Democrat during the next Presidential election (88% chance); otherwise, it is likely to vote Republican (82%). Our results suggest that automated systems for monitoring demographic trends may effectively complement labor-intensive approaches, with the potential to detect trends with fine spatial resolution, in close to real time.
 Add to Chrome
 Add to Firefox
 Add to Edge