David C. Wong
Contactless hand tremor amplitude measurement using smartphones: development and pilot evaluation
Apr 28, 2023
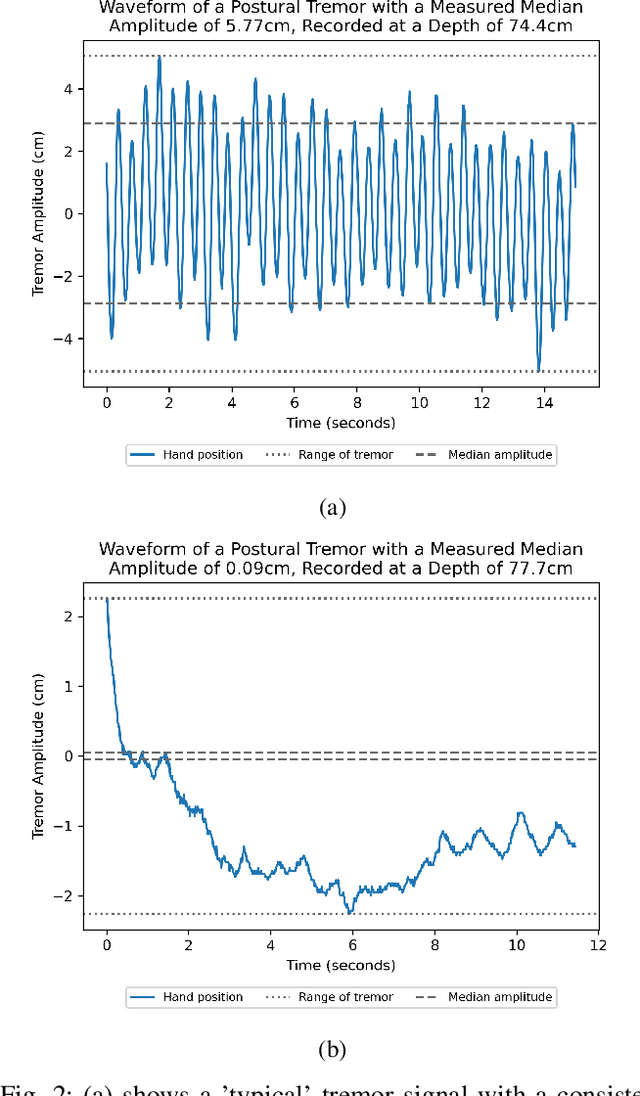
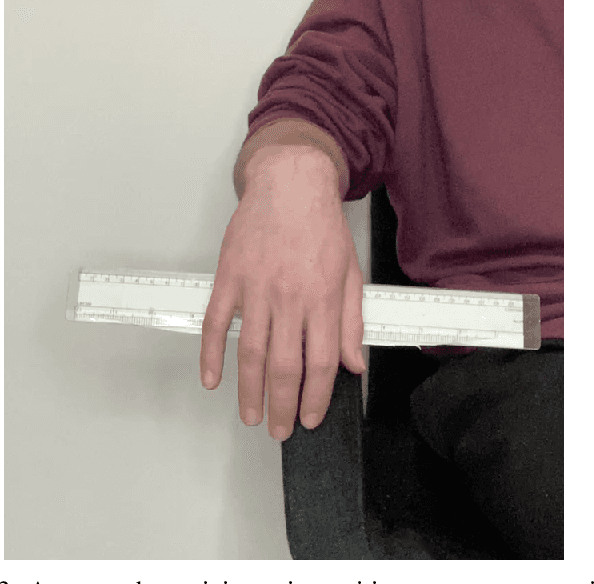
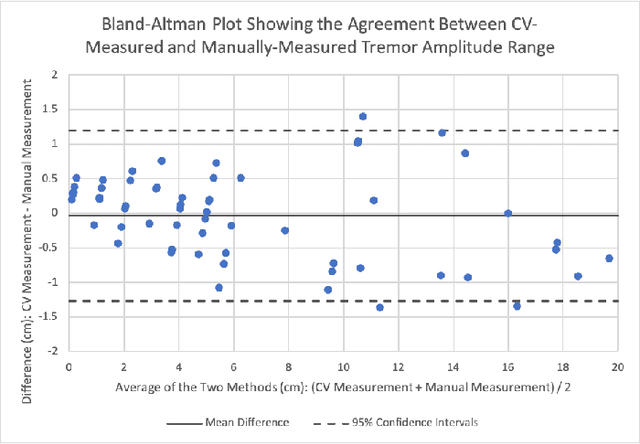
Abstract:Background: Physiological tremor is defined as an involuntary and rhythmic shaking. Tremor of the hand is a key symptom of multiple neurological diseases, and its frequency and amplitude differs according to both disease type and disease progression. In routine clinical practice, tremor frequency and amplitude are assessed by expert rating using a 0 to 4 integer scale. Such ratings are subjective and have poor inter-rater reliability. There is thus a clinical need for a practical and accurate method for objectively assessing hand tremor. Objective: to develop a proof of principle method to measure hand tremor amplitude from smartphone videos. Methods: We created a computer vision pipeline that automatically extracts salient points on the hand and produces a 1-D time series of movement due to tremor, in pixels. Using the smartphones' depth measurement, we convert this measure into real distance units. We assessed the accuracy of the method using 60 videos of simulated tremor of different amplitudes from two healthy adults. Videos were taken at distances of 50, 75 and 100 cm between hand and camera. The participants had skin tone II and VI on the Fitzpatrick scale. We compared our method to a gold-standard measurement from a slide rule. Bland-Altman methods agreement analysis indicated a bias of 0.04 cm and 95% limits of agreement from -1.27 to 1.20 cm. Furthermore, we qualitatively observed that the method was robust to differences in skin tone and limited occlusion, such as a band-aid affixed to the participant's hand. Clinical relevance: We have demonstrated how tremor amplitude can be measured from smartphone videos. In conjunction with tremor frequency, this approach could be used to help diagnose and monitor neurological diseases
Outlier detection of vital sign trajectories from COVID-19 patients
Jul 15, 2022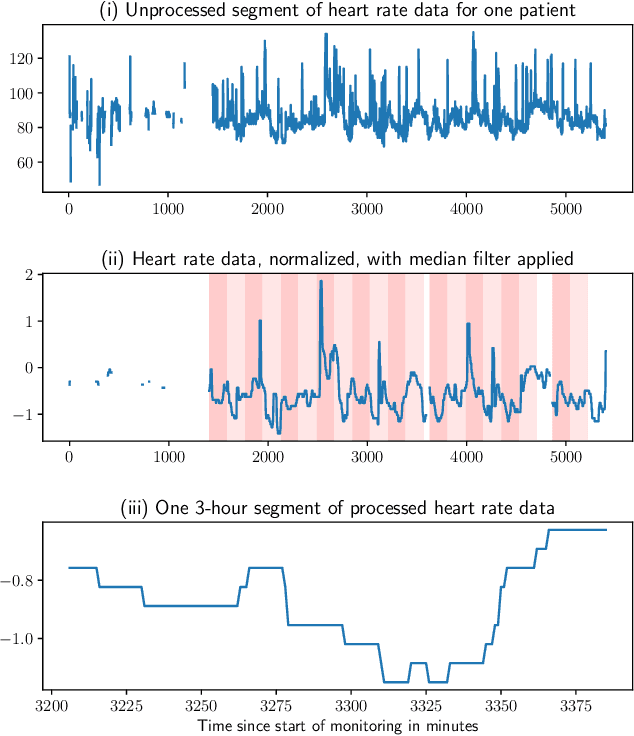
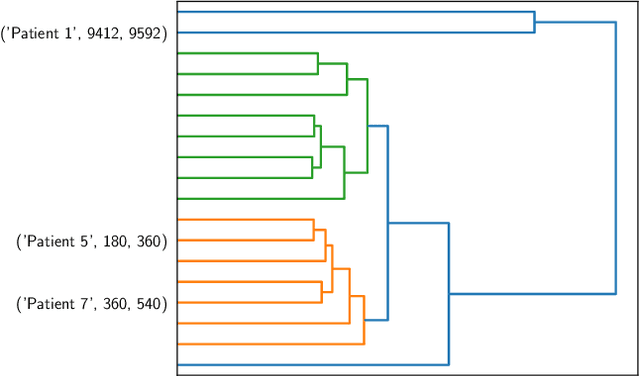
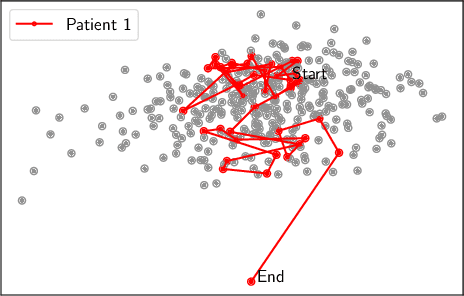
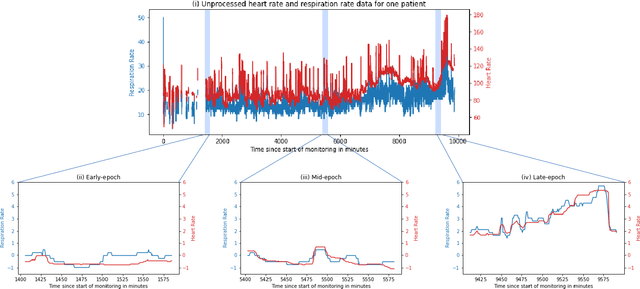
Abstract:There is growing interest in continuous wearable vital sign sensors for monitoring patients remotely at home. These monitors are usually coupled to an alerting system, which is triggered when vital sign measurements fall outside a predefined normal range. Trends in vital signs, such as an increasing heart rate, are often indicative of deteriorating health, but are rarely incorporated into alerting systems. In this work, we present a novel outlier detection algorithm to identify such abnormal vital sign trends. We introduce a distance-based measure to compare vital sign trajectories. For each patient in our dataset, we split vital sign time series into 180 minute, non-overlapping epochs. We then calculated a distance between all pairs of epochs using the dynamic time warp distance. Each epoch was characterized by its mean pairwise distance (average link distance) to all other epochs, with large distances considered as outliers. We applied this method to a pilot dataset collected over 1561 patient-hours from 8 patients who had recently been discharged from hospital after contracting COVID-19. We show that outlier epochs correspond well with patients who were subsequently readmitted to hospital. We also show, descriptively, how epochs transition from normal to abnormal for one such patient.
Analysis of an adaptive lead weighted ResNet for multiclass classification of 12-lead ECGs
Dec 01, 2021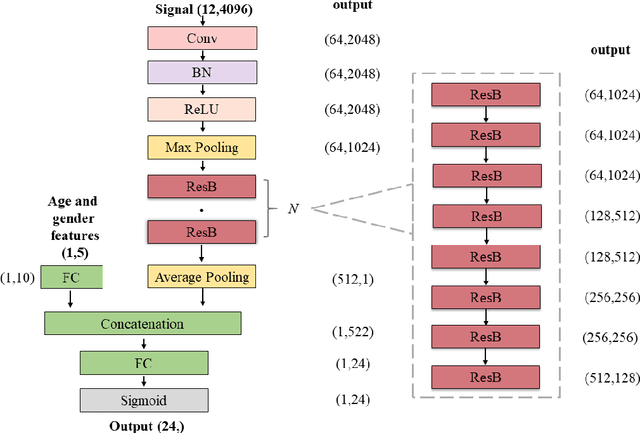

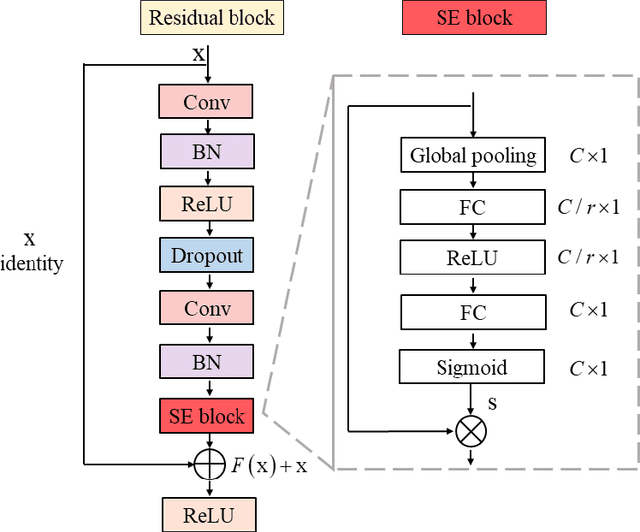
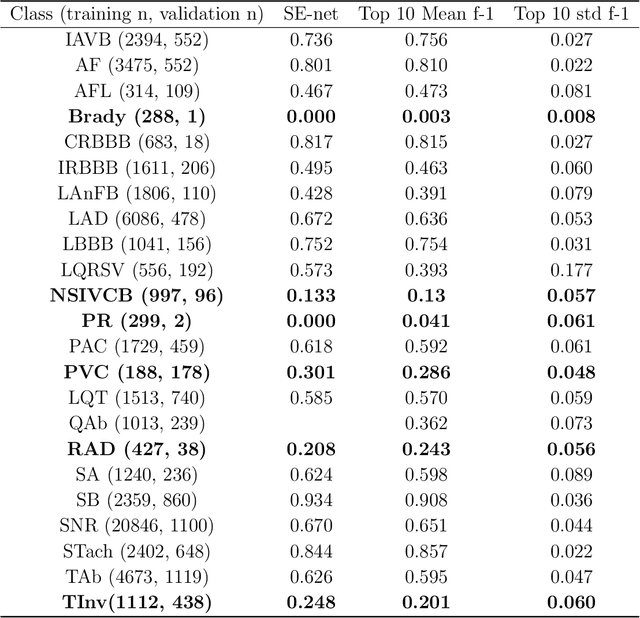
Abstract:Background: Twelve lead ECGs are a core diagnostic tool for cardiovascular diseases. Here, we describe and analyse an ensemble deep neural network architecture to classify 24 cardiac abnormalities from 12-lead ECGs. Method: We proposed a squeeze and excite ResNet to automatically learn deep features from 12-lead ECGs, in order to identify 24 cardiac conditions. The deep features were augmented with age and gender features in the final fully connected layers. Output thresholds for each class were set using a constrained grid search. To determine why the model made incorrect predictions, two expert clinicians independently interpreted a random set of 100 misclassified ECGs concerning Left Axis Deviation. Results: Using the bespoke weighted accuracy metric, we achieved a 5-fold cross validation score of 0.684, and sensitivity and specificity of 0.758 and 0.969, respectively. We scored 0.520 on the full test data, and ranked 2nd out of 41 in the official challenge rankings. On a random set of misclassified ECGs, agreement between two clinicians and training labels was poor (clinician 1: kappa = -0.057, clinician 2: kappa = -0.159). In contrast, agreement between the clinicians was very high (kappa = 0.92). Discussion: The proposed prediction model performed well on the validation and hidden test data in comparison to models trained on the same data. We also discovered considerable inconsistency in training labels, which is likely to hinder development of more accurate models.
 Add to Chrome
 Add to Firefox
 Add to Edge