Daisuke Sakurai
ZIB
GenéLive! Generating Rhythm Actions in Love Live!
Feb 25, 2022


Abstract:A rhythm action game is a music-based video game in which the player is challenged to issue commands at the right timings during a music session. The timings are rendered in the chart, which consists of visual symbols, called notes, flying through the screen. KLab Inc., a Japan-based video game developer, has operated rhythm action games including a title for the "Love Live!" franchise, which became a hit across Asia and beyond. Before this work, the company generated the charts manually, which resulted in a costly business operation. This paper presents how KLab applied a deep generative model for synthesizing charts, and shows how it has improved the chart production process, reducing the business cost by half. Existing generative models generated poor quality charts for easier difficulty modes. We report how we overcame this challenge through a multi-scaling model dedicated to rhythm actions, by considering beats among other things. Our model, named Gen\'eLive!, is evaluated using production datasets at KLab as well as open datasets.
Explicitly Multi-Modal Benchmarks for Multi-Objective Optimization
Oct 07, 2021


Abstract:We model multi-modality in multi-objective optimization problems and apply this to generate benchmarking problems. In the model, the mode is based on the singularity of the objective functions.
Topological Data Analysis Made Easy with the Topology ToolKit
Jun 21, 2018
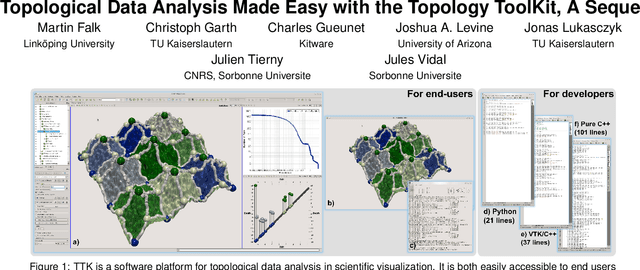
Abstract:This tutorial presents topological methods for the analysis and visualization of scientific data from a user's perspective, with the Topology ToolKit (TTK), a recently released open-source library for topological data analysis. Topological methods have gained considerably in popularity and maturity over the last twenty years and success stories of established methods have been documented in a wide range of applications (combustion, chemistry, astrophysics, material sciences, etc.) with both acquired and simulated data, in both post-hoc and in-situ contexts. While reference textbooks have been published on the topic, no tutorial at IEEE VIS has covered this area in recent years, and never at a software level and from a user's point-of-view. This tutorial fills this gap by providing a beginner's introduction to topological methods for practitioners, researchers, students, and lecturers. In particular, instead of focusing on theoretical aspects and algorithmic details, this tutorial focuses on how topological methods can be useful in practice for concrete data analysis tasks such as segmentation, feature extraction or tracking. The tutorial describes in detail how to achieve these tasks with TTK. First, after an introduction to topological methods and their application in data analysis, a brief overview of TTK's main entry point for end users, namely ParaView, will be presented. Second, an overview of TTK's main features will be given. A running example will be described in detail, showcasing how to access TTK's features via ParaView, Python, VTK/C++, and C++. Third, hands-on sessions will concretely show how to use TTK in ParaView for multiple, representative data analysis tasks. Fourth, the usage of TTK will be presented for developers, in particular by describing several examples of visualization and data analysis projects that were built on top of TTK. Finally, some feedback regarding the usage of TTK as a teaching platform for topological analysis will be given. Presenters of this tutorial include experts in topological methods, core authors of TTK as well as active users, coming from academia, labs, or industry. A large part of the tutorial will be dedicated to hands-on exercises and a rich material package (including TTK pre-installs in virtual machines, code, data, demos, video tutorials, etc.) will be provided to the participants. This tutorial mostly targets students, practitioners and researchers who are not experts in topological methods but who are interested in using them in their daily tasks. We also target researchers already familiar to topological methods and who are interested in using or contributing to TTK.
 Add to Chrome
 Add to Firefox
 Add to Edge