Charles K. Assaad
LIG, UGA
Regret-Based Federated Causal Discovery with Unknown Interventions
Dec 29, 2025Abstract:Most causal discovery methods recover a completed partially directed acyclic graph representing a Markov equivalence class from observational data. Recent work has extended these methods to federated settings to address data decentralization and privacy constraints, but often under idealized assumptions that all clients share the same causal model. Such assumptions are unrealistic in practice, as client-specific policies or protocols, for example, across hospitals, naturally induce heterogeneous and unknown interventions. In this work, we address federated causal discovery under unknown client-level interventions. We propose I-PERI, a novel federated algorithm that first recovers the CPDAG of the union of client graphs and then orients additional edges by exploiting structural differences induced by interventions across clients. This yields a tighter equivalence class, which we call the $\mathbfΦ$-Markov Equivalence Class, represented by the $\mathbfΦ$-CPDAG. We provide theoretical guarantees on the convergence of I-PERI, as well as on its privacy-preserving properties, and present empirical evaluations on synthetic data demonstrating the effectiveness of the proposed algorithm.
On Efficient Adjustment for Micro Causal Effects in Summary Causal Graphs
Dec 23, 2025Abstract:Observational studies in fields such as epidemiology often rely on covariate adjustment to estimate causal effects. Classical graphical criteria, like the back-door criterion and the generalized adjustment criterion, are powerful tools for identifying valid adjustment sets in directed acyclic graphs (DAGs). However, these criteria are not directly applicable to summary causal graphs (SCGs), which are abstractions of DAGs commonly used in dynamic systems. In SCGs, each node typically represents an entire time series and may involve cycles, making classical criteria inapplicable for identifying causal effects. Recent work established complete conditions for determining whether the micro causal effect of a treatment or an exposure $X_{t-γ}$ on an outcome $Y_t$ is identifiable via covariate adjustment in SCGs, under the assumption of no hidden confounding. However, these identifiability conditions have two main limitations. First, they are complex, relying on cumbersome definitions and requiring the enumeration of multiple paths in the SCG, which can be computationally expensive. Second, when these conditions are satisfied, they only provide two valid adjustment sets, limiting flexibility in practical applications. In this paper, we propose an equivalent but simpler formulation of those identifiability conditions and introduce a new criterion that identifies a broader class of valid adjustment sets in SCGs. Additionally, we characterize the quasi-optimal adjustment set among these, i.e., the one that minimizes the asymptotic variance of the causal effect estimator. Our contributions offer both theoretical advancement and practical tools for more flexible and efficient causal inference in abstracted causal graphs.
Orientability of Causal Relations in Time Series using Summary Causal Graphs and Faithful Distributions
Aug 29, 2025Abstract:Understanding causal relations between temporal variables is a central challenge in time series analysis, particularly when the full causal structure is unknown. Even when the full causal structure cannot be fully specified, experts often succeed in providing a high-level abstraction of the causal graph, known as a summary causal graph, which captures the main causal relations between different time series while abstracting away micro-level details. In this work, we present conditions that guarantee the orientability of micro-level edges between temporal variables given the background knowledge encoded in a summary causal graph and assuming having access to a faithful and causally sufficient distribution with respect to the true unknown graph. Our results provide theoretical guarantees for edge orientation at the micro-level, even in the presence of cycles or bidirected edges at the macro-level. These findings offer practical guidance for leveraging SCGs to inform causal discovery in complex temporal systems and highlight the value of incorporating expert knowledge to improve causal inference from observational time series data.
Identifiability by common backdoor in summary causal graphs of time series
Jun 17, 2025Abstract:The identifiability problem for interventions aims at assessing whether the total effect of some given interventions can be written with a do-free formula, and thus be computed from observational data only. We study this problem, considering multiple interventions and multiple effects, in the context of time series when only abstractions of the true causal graph in the form of summary causal graphs are available. We focus in this study on identifiability by a common backdoor set, and establish, for time series with and without consistency throughout time, conditions under which such a set exists. We also provide algorithms of limited complexity to decide whether the problem is identifiable or not.
Local Markov Equivalence and Local Causal Discovery for Identifying Controlled Direct Effects
May 05, 2025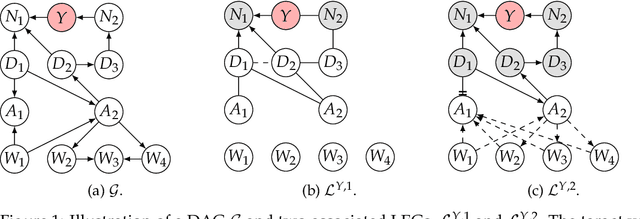

Abstract:Understanding and identifying controlled direct effects (CDEs) is crucial across numerous scientific domains, including public health. While existing methods can identify these effects from causal directed acyclic graphs (DAGs), the true underlying structure is often unknown in practice. Essential graphs, which represent a Markov equivalence class of DAGs characterized by the same set of d-separations, provide a more practical and realistic alternative. However, learning the full essential graph is computationally intensive and typically depends on strong, untestable assumptions. In this work, we characterize a local class of graphs, defined relative to a target variable, that share a specific subset of d-separations, and introduce a graphical representation of this class, called the local essential graph (LEG). We then present LocPC, a novel algorithm designed to recover the LEG from an observed distribution using only local conditional independence tests. Building on LocPC, we propose LocPC-CDE, an algorithm that discovers the portion of the LEG that is sufficient to identify a CDE, bypassing the need of retrieving the full essential graph. Compared to global methods, our algorithms require less conditional independence tests and operate under weaker assumptions while maintaining theoretical guarantees.
Identifying Macro Causal Effects in C-DMGs
Apr 02, 2025Abstract:Causal effect identification using causal graphs is a fundamental challenge in causal inference. While extensive research has been conducted in this area, most existing methods assume the availability of fully specified causal graphs. However, in complex domains such as medicine and epidemiology, complete causal knowledge is often unavailable, and only partial information about the system is accessible. This paper focuses on causal effect identification within partially specified causal graphs, with particular emphasis on cluster-directed mixed graphs (C-DMGs). These graphs provide a higher-level representation of causal relationships by grouping variables into clusters, offering a more practical approach for handling complex systems. Unlike fully specified causal graphs, C-DMGs can contain cycles, which complicate their analysis and interpretation. Furthermore, their cluster-based nature introduces new challenges, as it gives rise to two distinct types of causal effects, macro causal effects and micro causal effects, with different properties. In this work, we focus on macro causal effects, which describe the effects of entire clusters on other clusters. We establish that the do-calculus is both sound and complete for identifying these effects in C-DMGs. Additionally, we provide a graphical characterization of non-identifiability for macro causal effects in these graphs.
Discovering maximally consistent distribution of causal tournaments with Large Language Models
Dec 18, 2024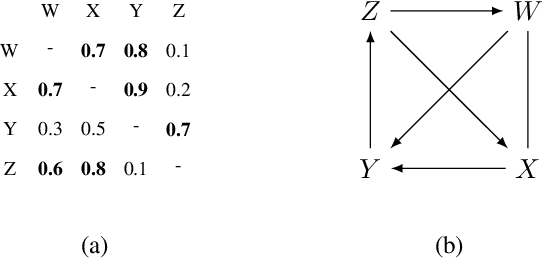
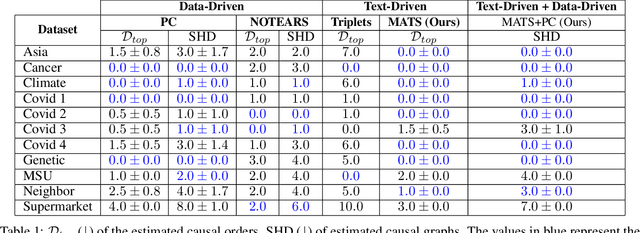
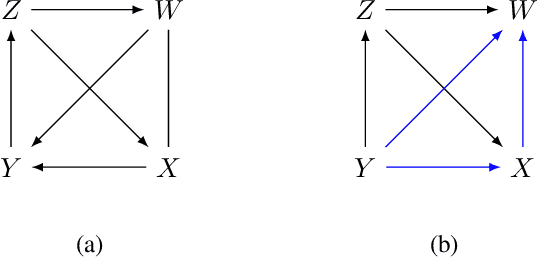
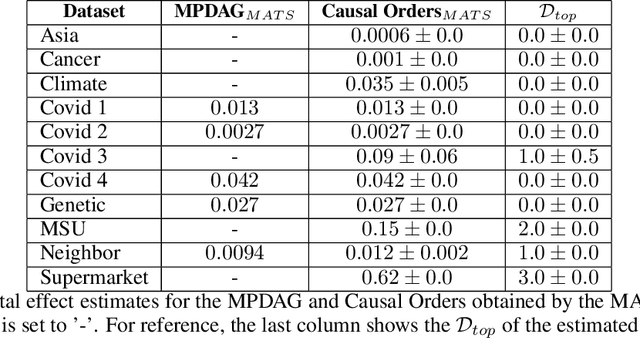
Abstract:Causal discovery is essential for understanding complex systems, yet traditional methods often depend on strong, untestable assumptions, making the process challenging. Large Language Models (LLMs) present a promising alternative for extracting causal insights from text-based metadata, which consolidates domain expertise. However, LLMs are prone to unreliability and hallucinations, necessitating strategies that account for their limitations. One such strategy involves leveraging a consistency measure to evaluate reliability. Additionally, most text metadata does not clearly distinguish direct causal relationships from indirect ones, further complicating the inference of causal graphs. As a result, focusing on causal orderings, rather than causal graphs, emerges as a more practical and robust approach. We propose a novel method to derive a distribution of acyclic tournaments (representing plausible causal orders) that maximizes a consistency score. Our approach begins by computing pairwise consistency scores between variables, yielding a cyclic tournament that aggregates these scores. From this structure, we identify optimal acyclic tournaments compatible with the original tournament, prioritizing those that maximize consistency across all configurations. We tested our method on both classical and well-established bechmarks, as well as real-world datasets from epidemiology and public health. Our results demonstrate the effectiveness of our approach in recovering distributions causal orders with minimal error.
Causal reasoning in difference graphs
Nov 02, 2024Abstract:In epidemiology, understanding causal mechanisms across different populations is essential for designing effective public health interventions. Recently, difference graphs have been introduced as a tool to visually represent causal variations between two distinct populations. While there has been progress in inferring these graphs from data through causal discovery methods, there remains a gap in systematically leveraging their potential to enhance causal reasoning. This paper addresses that gap by establishing conditions for identifying causal changes and effects using difference graphs and observational data. It specifically focuses on identifying total causal changes and total effects in a nonparametric framework, as well as direct causal changes and direct effects in a linear context. In doing so, it provides a novel approach to causal reasoning that holds potential for various public health applications.
Average Controlled and Average Natural Micro Direct Effects in Summary Causal Graphs
Oct 31, 2024
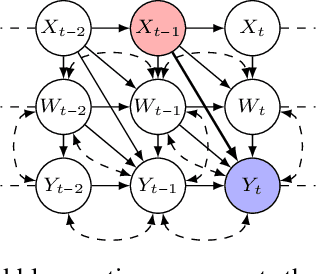

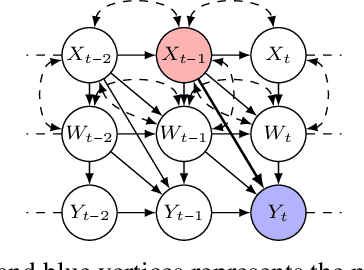
Abstract:In this paper, we investigate the identifiability of average controlled direct effects and average natural direct effects in causal systems represented by summary causal graphs, which are abstractions of full causal graphs, often used in dynamic systems where cycles and omitted temporal information complicate causal inference. Unlike in the traditional linear setting, where direct effects are typically easier to identify and estimate, non-parametric direct effects, which are crucial for handling real-world complexities, particularly in epidemiological contexts where relationships between variables (e.g, genetic, environmental, and behavioral factors) are often non-linear, are much harder to define and identify. In particular, we give sufficient conditions for identifying average controlled micro direct effect and average natural micro direct effect from summary causal graphs in the presence of hidden confounding. Furthermore, we show that the conditions given for the average controlled micro direct effect become also necessary in the setting where there is no hidden confounding and where we are only interested in identifiability by adjustment.
Identifying macro conditional independencies and macro total effects in summary causal graphs with latent confounding
Jul 10, 2024Abstract:Understanding causal relationships in dynamic systems is essential for numerous scientific fields, including epidemiology, economics, and biology. While causal inference methods have been extensively studied, they often rely on fully specified causal graphs, which may not always be available or practical in complex dynamic systems. Partially specified causal graphs, such as summary causal graphs (SCGs), provide a simplified representation of causal relationships, omitting temporal information and focusing on high-level causal structures. This simplification introduces new challenges concerning the types of queries of interest: macro queries, which involve relationships between clusters represented as vertices in the graph, and micro queries, which pertain to relationships between variables that are not directly visible through the vertices of the graph. In this paper, we first clearly distinguish between macro conditional independencies and micro conditional independencies and between macro total effects and micro total effects. Then, we demonstrate the soundness and completeness of the d-separation to identify macro conditional independencies in SCGs. Furthermore, we establish that the do-calculus is sound and complete for identifying macro total effects in SCGs. Conversely, we also show through various examples that these results do not hold when considering micro conditional independencies and micro total effects.
 Add to Chrome
 Add to Firefox
 Add to Edge