Brian Summa
Model-Centric Diagnostics: A Framework for Internal State Readouts
Jan 31, 2026Abstract:We present a model-centric diagnostic framework that treats training state as a latent variable and unifies a family of internal readouts -- head-gradient norms, confidence, entropy, margin, and related signals -- as anchor-relative projections of that state. A preliminary version of this work introduced a head-gradient probe for checkpoint selection. In this version, we focus on the unifying perspective and structural diagnostics; full algorithmic details, theoretical analysis, and experimental validation will appear in a forthcoming paper. We outline the conceptual scaffold: any prediction head induces a local loss landscape whose geometry (gradient magnitude, curvature, sharpness) reflects how well the upstream features are aligned with the task. Different readout choices -- gradient norms, softmax entropy, predictive margin -- correspond to different projections of this geometry, each with complementary strengths. The framework suggests that checkpoint selection, early stopping, and lightweight architecture pre-screening can all be viewed as querying the same underlying state through different lenses. Illustrative experiments on ImageNet classification and COCO detection/segmentation hint at the practical potential; rigorous benchmarks and ablations are deferred to the full paper.
No Validation, No Problem: Predicting Model Performance from a Single Gradient
Jan 23, 2026Abstract:We propose a validation-free checkpointing signal from a single forward-backward pass: the Frobenius norm of the classifier-head gradient on one detached-feature batch, ||g||_F = ||dL/dW||_F. Across ImageNet-1k CNNs and Transformers, this proxy is strongly negative with Top-1 and positive with loss. Selecting the checkpoint with the minimum head gradient in a short tail window closes most of the gap to the oracle (4.24% +/- 2.00% with a universal setup, about 1.12% with light per-family tuning). For practical deployment, a head-scale normalization is more stable within classic CNN families (e.g., ResNets), while a feature-scale normalization works well for Transformers and modern CNNs. The same one-batch probe also predicts COCO detection/segmentation mAP. In diffusion (UNet/DDPM on CIFAR-10), it tracks progress and enables near-oracle tail-window selection; it is positively correlated with same-distribution probe MSE and negatively with FID (lower is better), so it can be used as a lightweight, label-free monitor. Validation labels are never used beyond reporting. The probe adds much less than 0.1% of an epoch and works as a drop-in for validation-free checkpoint selection and early stopping.
Rapid and Precise Topological Comparison with Merge Tree Neural Networks
Apr 08, 2024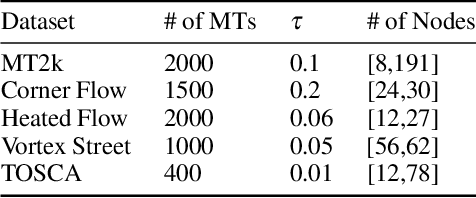
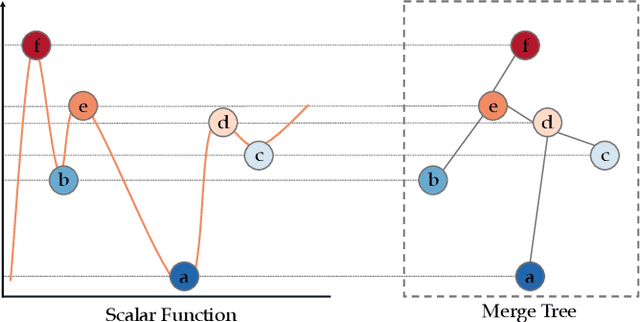
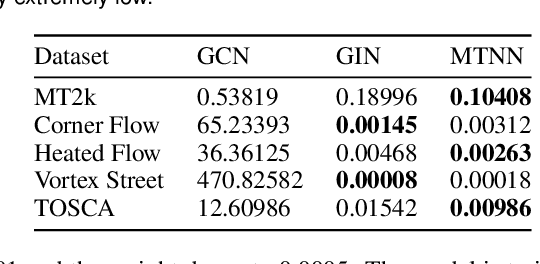
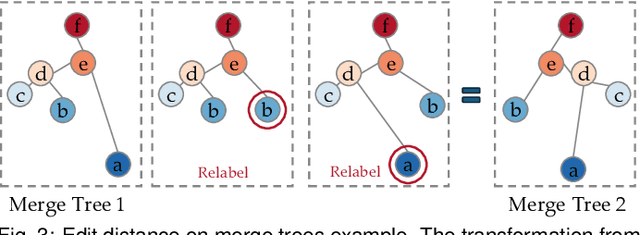
Abstract:Merge trees are a valuable tool in scientific visualization of scalar fields; however, current methods for merge tree comparisons are computationally expensive, primarily due to the exhaustive matching between tree nodes. To address this challenge, we introduce the merge tree neural networks (MTNN), a learned neural network model designed for merge tree comparison. The MTNN enables rapid and high-quality similarity computation. We first demonstrate how graph neural networks (GNNs), which emerged as an effective encoder for graphs, can be trained to produce embeddings of merge trees in vector spaces that enable efficient similarity comparison. Next, we formulate the novel MTNN model that further improves the similarity comparisons by integrating the tree and node embeddings with a new topological attention mechanism. We demonstrate the effectiveness of our model on real-world data in different domains and examine our model's generalizability across various datasets. Our experimental analysis demonstrates our approach's superiority in accuracy and efficiency. In particular, we speed up the prior state-of-the-art by more than 100x on the benchmark datasets while maintaining an error rate below 0.1%.
Visualizing Topological Importance: A Class-Driven Approach
Sep 22, 2023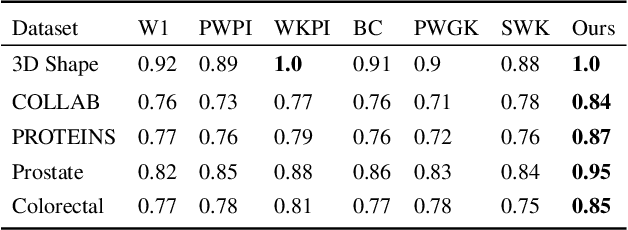
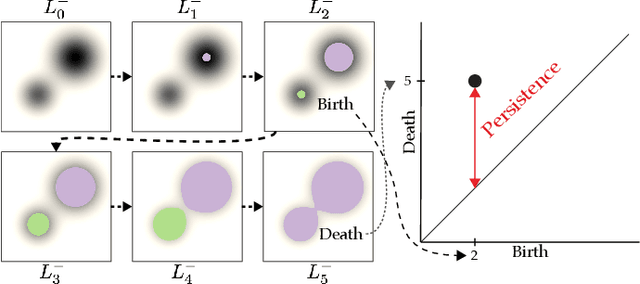
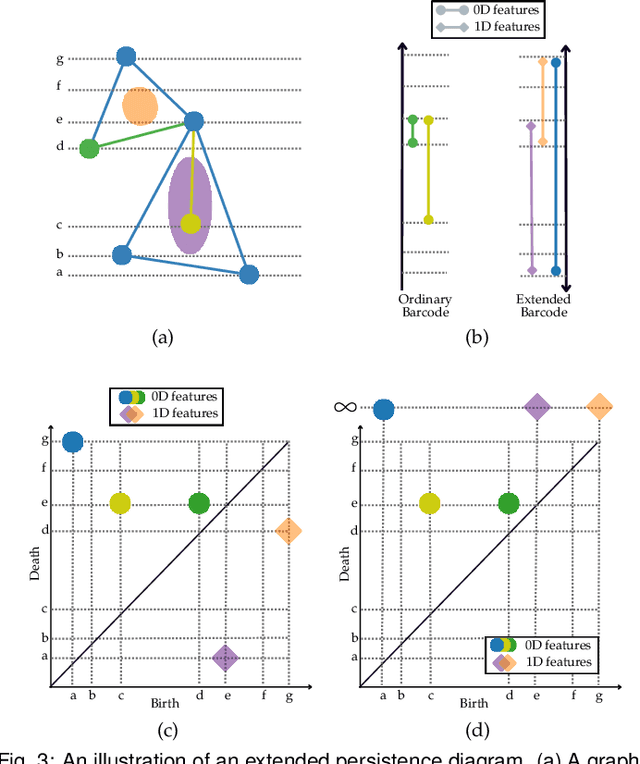
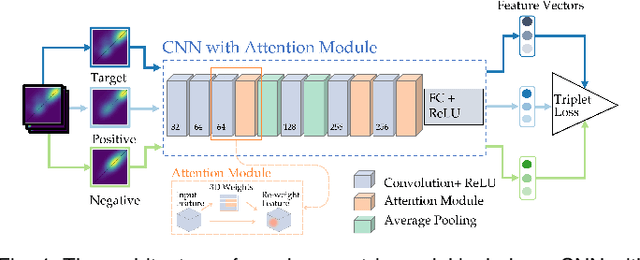
Abstract:This paper presents the first approach to visualize the importance of topological features that define classes of data. Topological features, with their ability to abstract the fundamental structure of complex data, are an integral component of visualization and analysis pipelines. Although not all topological features present in data are of equal importance. To date, the default definition of feature importance is often assumed and fixed. This work shows how proven explainable deep learning approaches can be adapted for use in topological classification. In doing so, it provides the first technique that illuminates what topological structures are important in each dataset in regards to their class label. In particular, the approach uses a learned metric classifier with a density estimator of the points of a persistence diagram as input. This metric learns how to reweigh this density such that classification accuracy is high. By extracting this weight, an importance field on persistent point density can be created. This provides an intuitive representation of persistence point importance that can be used to drive new visualizations. This work provides two examples: Visualization on each diagram directly and, in the case of sublevel set filtrations on images, directly on the images themselves. This work highlights real-world examples of this approach visualizing the important topological features in graph, 3D shape, and medical image data.
A Domain-Oblivious Approach for Learning Concise Representations of Filtered Topological Spaces
May 25, 2021
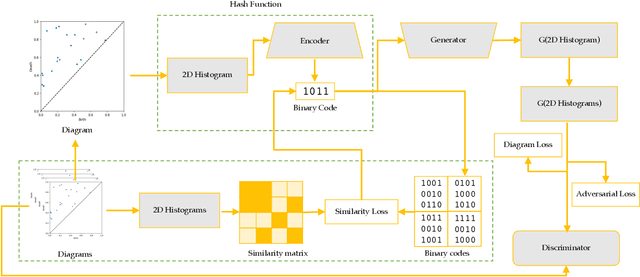

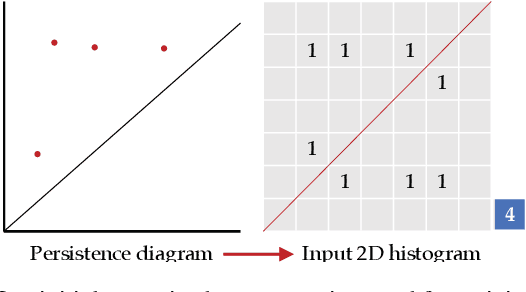
Abstract:Persistence diagrams have been widely used to quantify the underlying features of filtered topological spaces in data visualization. In many applications, computing distances between diagrams is essential; however, computing these distances has been challenging due to the computational cost. In this paper, we propose a persistence diagram hashing framework that learns a binary code representation of persistence diagrams, which allows for fast computation of distances. This framework is built upon a generative adversarial network (GAN) with a diagram distance loss function to steer the learning process. Instead of attempting to transform diagrams into vectorized representations, we hash diagrams into binary codes, which have natural advantages in large-scale tasks. The training of this model is domain-oblivious in that it can be computed purely from synthetic, randomly created diagrams. As a consequence, our proposed method is directly applicable to various datasets without the need of retraining the model. These binary codes, when compared using fast Hamming distance, better maintain topological similarity properties between datasets than other vectorized representations. To evaluate this method, we apply our framework to the problem of diagram clustering and we compare the quality and performance of our approach to the state-of-the-art. In addition, we show the scalability of our approach on a dataset with 10k persistence diagrams, which is not possible with current techniques. Moreover, our experimental results demonstrate that our method is significantly faster with less memory usage, while retaining comparable or better quality comparisons.
Persistence Atlas for Critical Point Variability in Ensembles
Jul 30, 2018


Abstract:This paper presents a new approach for the visualization and analysis of the spatial variability of features of interest represented by critical points in ensemble data. Our framework, called Persistence Atlas, enables the visualization of the dominant spatial patterns of critical points, along with statistics regarding their occurrence in the ensemble. The persistence atlas represents in the geometrical domain each dominant pattern in the form of a confidence map for the appearance of critical points. As a by-product, our method also provides 2-dimensional layouts of the entire ensemble, highlighting the main trends at a global level. Our approach is based on the new notion of Persistence Map, a measure of the geometrical density in critical points which leverages the robustness to noise of topological persistence to better emphasize salient features. We show how to leverage spectral embedding to represent the ensemble members as points in a low-dimensional Euclidean space, where distances between points measure the dissimilarities between critical point layouts and where statistical tasks, such as clustering, can be easily carried out. Further, we show how the notion of mandatory critical point can be leveraged to evaluate for each cluster confidence regions for the appearance of critical points. Most of the steps of this framework can be trivially parallelized and we show how to efficiently implement them. Extensive experiments demonstrate the relevance of our approach. The accuracy of the confidence regions provided by the persistence atlas is quantitatively evaluated and compared to a baseline strategy using an off-the-shelf clustering approach. We illustrate the importance of the persistence atlas in a variety of real-life datasets, where clear trends in feature layouts are identified and analyzed.
 Add to Chrome
 Add to Firefox
 Add to Edge