Boris Kovalerchuk
Department of Computer Science, Central Washington University, USA
Fully Explainable Classification Models Using Hyperblocks
Jun 08, 2025Abstract:Building on existing work with Hyperblocks, which classify data using minimum and maximum bounds for each attribute, we focus on enhancing interpretability, decreasing training time, and reducing model complexity without sacrificing accuracy. This system allows subject matter experts (SMEs) to directly inspect and understand the model's decision logic without requiring extensive machine learning expertise. To reduce Hyperblock complexity while retaining performance, we introduce a suite of algorithms for Hyperblock simplification. These include removing redundant attributes, removing redundant blocks through overlap analysis, and creating disjunctive units. These methods eliminate unnecessary parameters, dramatically reducing model size without harming classification power. We increase robustness by introducing an interpretable fallback mechanism using k-Nearest Neighbor (k-NN) classifiers for points not covered by any block, ensuring complete data coverage while preserving model transparency. Our results demonstrate that interpretable models can scale to high-dimensional, large-volume datasets while maintaining competitive accuracy. On benchmark datasets such as WBC (9-D), we achieve strong predictive performance with significantly reduced complexity. On MNIST (784-D), our method continues to improve through tuning and simplification, showing promise as a transparent alternative to black-box models in domains where trust, clarity, and control are crucial.
Boosting of Classification Models with Human-in-the-Loop Computational Visual Knowledge Discovery
Feb 10, 2025Abstract:High-risk artificial intelligence and machine learning classification tasks, such as healthcare diagnosis, require accurate and interpretable prediction models. However, classifier algorithms typically sacrifice individual case-accuracy for overall model accuracy, limiting analysis of class overlap areas regardless of task significance. The Adaptive Boosting meta-algorithm, which won the 2003 G\"odel Prize, analytically assigns higher weights to misclassified cases to reclassify. However, it relies on weaker base classifiers that are iteratively strengthened, limiting improvements from base classifiers. Combining visual and computational approaches enables selecting stronger base classifiers before boosting. This paper proposes moving boosting methodology from focusing on only misclassified cases to all cases in the class overlap areas using Computational and Interactive Visual Learning (CIVL) with a Human-in-the-Loop. It builds classifiers in lossless visualizations integrating human domain expertise and visual insights. A Divide and Classify process splits cases to simple and complex, classifying these individually through computational analysis and data visualization with lossless visualization spaces of Parallel Coordinates or other General Line Coordinates. After finding pure and overlap class areas simple cases in pure areas are classified, generating interpretable sub-models like decision rules in Propositional and First-order Logics. Only multidimensional cases in the overlap areas are losslessly visualized simplifying end-user cognitive tasks to identify difficult case patterns, including engineering features to form new classifiable patterns. Demonstration shows a perfectly accurate and losslessly interpretable model of the Iris dataset, and simulated data shows generalized benefits to accuracy and interpretability of models, increasing end-user confidence in discovered models.
Synthetic Data Generation and Automated Multidimensional Data Labeling for AI/ML in General and Circular Coordinates
Sep 03, 2024Abstract:Insufficient amounts of available training data is a critical challenge for both development and deployment of artificial intelligence and machine learning (AI/ML) models. This paper proposes a unified approach to both synthetic data generation (SDG) and automated data labeling (ADL) with a unified SDG-ADL algorithm. SDG-ADL uses multidimensional (n-D) representations of data visualized losslessly with General Line Coordinates (GLCs), relying on reversible GLC properties to visualize n-D data in multiple GLCs. This paper demonstrates use of the new Circular Coordinates in Static and Dynamic forms, used with Parallel Coordinates and Shifted Paired Coordinates, since each GLC exemplifies unique data properties, such as interattribute n-D distributions and outlier detection. The approach is interactively implemented in computer software with the Dynamic Coordinates Visualization system (DCVis). Results with real data are demonstrated in case studies, evaluating impact on classifiers.
General Line Coordinates in 3D
Mar 17, 2024Abstract:Interpretable interactive visual pattern discovery in lossless 3D visualization is a promising way to advance machine learning. It enables end users who are not data scientists to take control of the model development process as a self-service. It is conducted in 3D General Line Coordinates (GLC) visualization space, which preserves all n-D information in 3D. This paper presents a system which combines three types of GLC: Shifted Paired Coordinates (SPC), Shifted Tripled Coordinates (STC), and General Line Coordinates-Linear (GLC-L) for interactive visual pattern discovery. A transition from 2-D visualization to 3-D visualization allows for a more distinct visual pattern than in 2-D and it also allows for finding the best data viewing positions, which are not available in 2-D. It enables in-depth visual analysis of various class-specific data subsets comprehensible for end users in the original interpretable attributes. Controlling model overgeneralization by end users is an additional benefit of this approach.
Explainable Machine Learning for Categorical and Mixed Data with Lossless Visualization
May 29, 2023Abstract:Building accurate and interpretable Machine Learning (ML) models for heterogeneous/mixed data is a long-standing challenge for algorithms designed for numeric data. This work focuses on developing numeric coding schemes for non-numeric attributes for ML algorithms to support accurate and explainable ML models, methods for lossless visualization of n-D non-numeric categorical data with visual rule discovery in these visualizations, and accurate and explainable ML models for categorical data. This study proposes a classification of mixed data types and analyzes their important role in Machine Learning. It presents a toolkit for enforcing interpretability of all internal operations of ML algorithms on mixed data with a visual data exploration on mixed data. A new Sequential Rule Generation (SRG) algorithm for explainable rule generation with categorical data is proposed and successfully evaluated in multiple computational experiments. This work is one of the steps to the full scope ML algorithms for mixed data supported by lossless visualization of n-D data in General Line Coordinates beyond Parallel Coordinates.
Full High-Dimensional Intelligible Learning In 2-D Lossless Visualization Space
May 29, 2023Abstract:This study explores a new methodology for machine learning classification tasks in 2-dimensional visualization space (2-D ML) using Visual knowledge Discovery in lossless General Line Coordinates. It is shown that this is a full machine learning approach that does not require processing n-dimensional data in an abstract n-dimensional space. It enables discovering n-D patterns in 2-D space without loss of n-D information using graph representations of n-D data in 2-D. Specifically, this study shows that it can be done with static and dynamic In-line Based Coordinates in different modifications, which are a category of General Line Coordinates. Based on these inline coordinates, classification and regression methods were developed. The viability of the strategy was shown by two case studies based on benchmark datasets (Wisconsin Breast Cancer and Page Block Classification datasets). The characteristics of page block classification data led to the development of an algorithm for imbalanced high-resolution data with multiple classes, which exploits the decision trees as a model design facilitator producing a model, which is more general than a decision tree. This work accelerates the ongoing consolidation of an emerging field of full 2-D machine learning and its methodology. Within this methodology the end users can discover models and justify them as self-service. Providing interpretable ML models is another benefit of this approach.
Visual Knowledge Discovery with General Line Coordinates
May 28, 2023Abstract:Understanding black-box Machine Learning methods on multidimensional data is a key challenge in Machine Learning. While many powerful Machine Learning methods already exist, these methods are often unexplainable or perform poorly on complex data. This paper proposes visual knowledge discovery approaches based on several forms of lossless General Line Coordinates. These are an expansion of the previously introduced General Line Coordinates Linear and Dynamic Scaffolding Coordinates to produce, explain, and visualize non-linear classifiers with explanation rules. To ensure these non-linear models and rules are accurate, General Line Coordinates Linear also developed new interactive visual knowledge discovery algorithms for finding worst-case validation splits. These expansions are General Line Coordinates non-linear, interactive rules linear, hyperblock rules linear, and worst-case linear. Experiments across multiple benchmark datasets show that this visual knowledge discovery method can compete with other visual and computational Machine Learning algorithms while improving both interpretability and accuracy in linear and non-linear classifications. Major benefits from these expansions consist of the ability to build accurate and highly interpretable models and rules from hyperblocks, the ability to analyze interpretability weaknesses in a model, and the input of expert knowledge through interactive and human-guided visual knowledge discovery methods.
Parallel Coordinates for Discovery of Interpretable Machine Learning Models
May 28, 2023Abstract:This work uses visual knowledge discovery in parallel coordinates to advance methods of interpretable machine learning. The graphic data representation in parallel coordinates made the concepts of hypercubes and hyperblocks (HBs) simple to understand for end users. It is suggested to use mixed and pure hyperblocks in the proposed data classifier algorithm Hyper. It is shown that Hyper models generalize decision trees. The algorithm is presented in several settings and options to discover interactively or automatically overlapping or non-overlapping hyperblocks. Additionally, the use of hyperblocks in conjunction with language descriptions of visual patterns is demonstrated. The benchmark data from the UCI ML repository were used to evaluate the Hyper algorithm. It enabled the discovery of mixed and pure HBs evaluated using 10-fold cross validation. Connections among hyperblocks, dimension reduction and visualization have been established. The capability of end users to find and observe hyperblocks, as well as the ability of side-by-side visualizations to make patterns evident, are among major advantages ofhyperblock technology and the Hyper algorithm. A new method to visualize incomplete n-D data with missing values is proposed, while the traditional parallel coordinates do not support it. The ability of HBs to better prevent both overgeneralization and overfitting of data over decision trees is demonstrated as another benefit of the hyperblocks. The features of VisCanvas 2.0 software tool that implements Hyper technology are presented.
Explainable Mixed Data Representation and Lossless Visualization Toolkit for Knowledge Discovery
Jun 13, 2022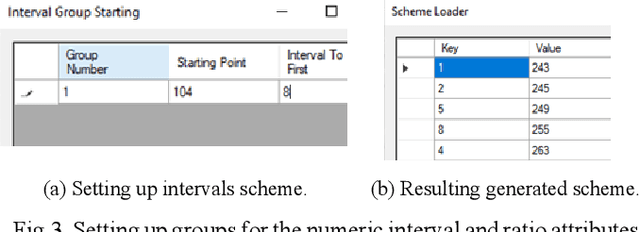

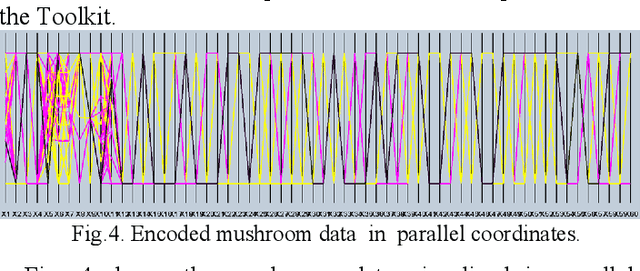
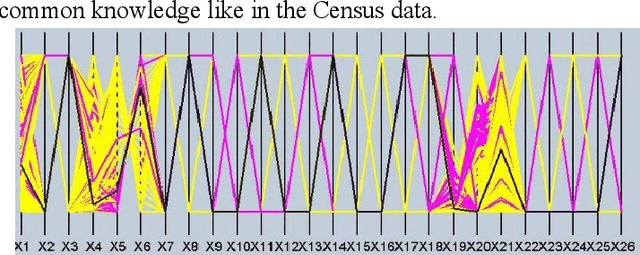
Abstract:Developing Machine Learning (ML) algorithms for heterogeneous/mixed data is a longstanding problem. Many ML algorithms are not applicable to mixed data, which include numeric and non-numeric data, text, graphs and so on to generate interpretable models. Another longstanding problem is developing algorithms for lossless visualization of multidimensional mixed data. The further progress in ML heavily depends on success interpretable ML algorithms for mixed data and lossless interpretable visualization of multidimensional data. The later allows developing interpretable ML models using visual knowledge discovery by end-users, who can bring valuable domain knowledge which is absent in the training data. The challenges for mixed data include: (1) generating numeric coding schemes for non-numeric attributes for numeric ML algorithms to provide accurate and interpretable ML models, (2) generating methods for lossless visualization of n-D non-numeric data and visual rule discovery in these visualizations. This paper presents a classification of mixed data types, analyzes their importance for ML and present the developed experimental toolkit to deal with mixed data. It combines the Data Types Editor, VisCanvas data visualization and rule discovery system which is available on GitHub.
Visualization of Decision Trees based on General Line Coordinates to Support Explainable Models
May 09, 2022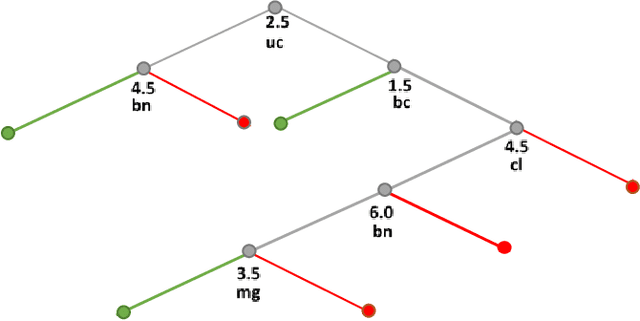


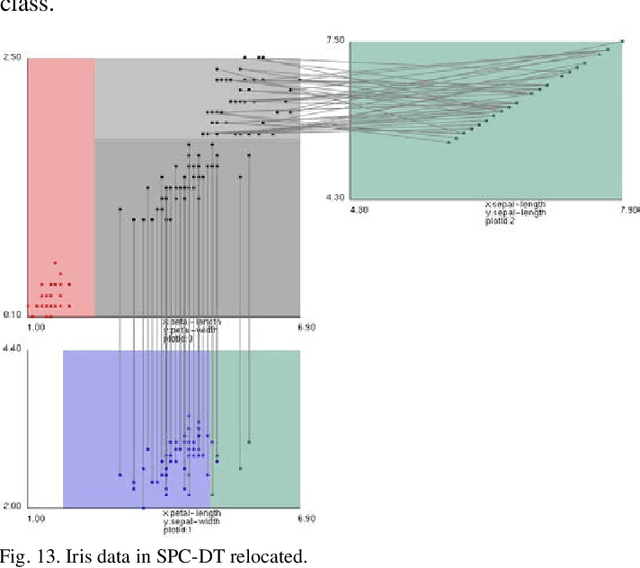
Abstract:Visualization of Machine Learning (ML) models is an important part of the ML process to enhance the interpretability and prediction accuracy of the ML models. This paper proposes a new method SPC-DT to visualize the Decision Tree (DT) as interpretable models. These methods use a version of General Line Coordinates called Shifted Paired Coordinates (SPC). In SPC, each n-D point is visualized in a set of shifted pairs of 2-D Cartesian coordinates as a directed graph. The new method expands and complements the capabilities of existing methods, to visualize DT models. It shows: (1) relations between attributes, (2) individual cases relative to the DT structure, (3) data flow in the DT, (4) how tight each split is to thresholds in the DT nodes, and (5) the density of cases in parts of the n-D space. This information is important for domain experts for evaluating and improving the DT models, including avoiding overgeneralization and overfitting of models, along with their performance. The benefits of the methods are demonstrated in the case studies, using three real datasets.
 Add to Chrome
 Add to Firefox
 Add to Edge