Alex Worland
Interactive Decision Tree Creation and Enhancement with Complete Visualization for Explainable Modeling
May 28, 2023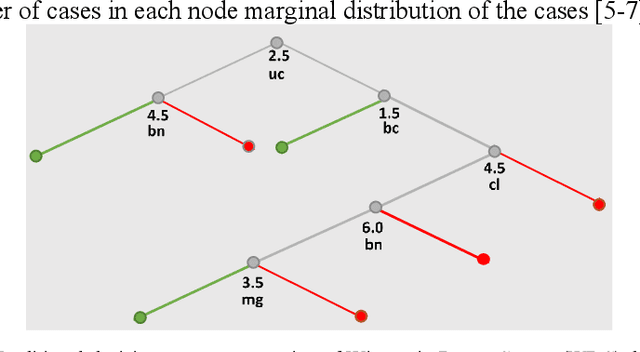
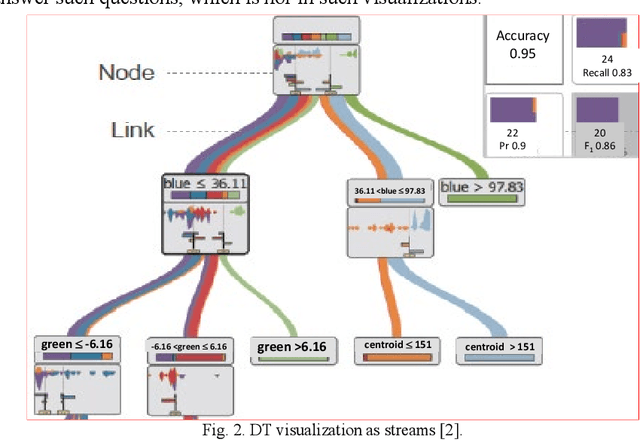

Abstract:To increase the interpretability and prediction accuracy of the Machine Learning (ML) models, visualization of ML models is a key part of the ML process. Decision Trees (DTs) are essential in machine learning (ML) because they are used to understand many black box ML models including Deep Learning models. In this research, two new methods for creation and enhancement with complete visualizing Decision Trees as understandable models are suggested. These methods use two versions of General Line Coordinates (GLC): Bended Coordinates (BC) and Shifted Paired Coordinates (SPC). The Bended Coordinates are a set of line coordinates, where each coordinate is bended in a threshold point of the respective DT node. In SPC, each n-D point is visualized in a set of shifted pairs of 2-D Cartesian coordinates as a directed graph. These new methods expand and complement the capabilities of existing methods to visualize DT models more completely. These capabilities allow us to observe and analyze: (1) relations between attributes, (2) individual cases relative to the DT structure, (3) data flow in the DT, (4) sensitivity of each split threshold in the DT nodes, and (5) density of cases in parts of the n-D space. These features are critical for DT models' performance evaluation and improvement by domain experts and end users as they help to prevent overgeneralization and overfitting of the models. The advantages of this methodology are illustrated in the case studies on benchmark real-world datasets. The paper also demonstrates how to generalize them for decision tree visualizations in different General Line Coordinates.
Visualization of Decision Trees based on General Line Coordinates to Support Explainable Models
May 09, 2022


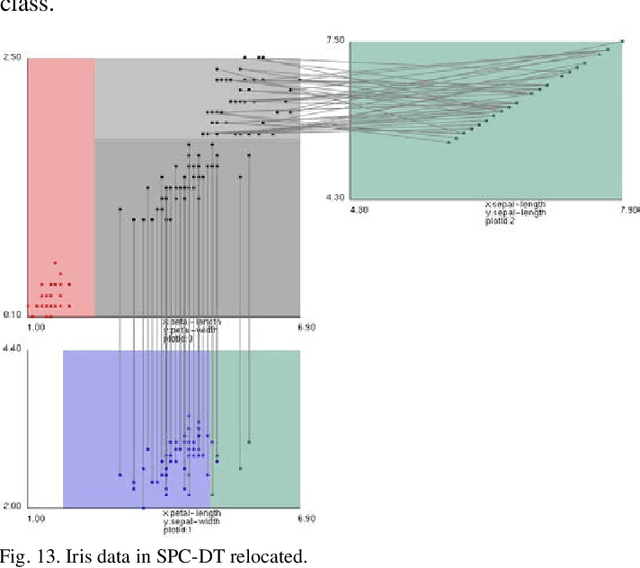
Abstract:Visualization of Machine Learning (ML) models is an important part of the ML process to enhance the interpretability and prediction accuracy of the ML models. This paper proposes a new method SPC-DT to visualize the Decision Tree (DT) as interpretable models. These methods use a version of General Line Coordinates called Shifted Paired Coordinates (SPC). In SPC, each n-D point is visualized in a set of shifted pairs of 2-D Cartesian coordinates as a directed graph. The new method expands and complements the capabilities of existing methods, to visualize DT models. It shows: (1) relations between attributes, (2) individual cases relative to the DT structure, (3) data flow in the DT, (4) how tight each split is to thresholds in the DT nodes, and (5) the density of cases in parts of the n-D space. This information is important for domain experts for evaluating and improving the DT models, including avoiding overgeneralization and overfitting of models, along with their performance. The benefits of the methods are demonstrated in the case studies, using three real datasets.
 Add to Chrome
 Add to Firefox
 Add to Edge