Anders Ellern Bilgrau
rags2ridges: A One-Stop-Shop for Graphical Modeling of High-Dimensional Precision Matrices
Oct 12, 2020


Abstract:A graphical model is an undirected network representing the conditional independence properties between random variables. Graphical modeling has become part and parcel of systems or network approaches to multivariate data, in particular when the variable dimension exceeds the observation dimension. rags2ridges is an R package for graphical modeling of high-dimensional precision matrices. It provides a modular framework for the extraction, visualization, and analysis of Gaussian graphical models from high-dimensional data. Moreover, it can handle the incorporation of prior information as well as multiple heterogeneous data classes. As such, it provides a one-stop-shop for graphical modeling of high-dimensional precision matrices. The functionality of the package is illustrated with an example dataset pertaining to blood-based metabolite measurements in persons suffering from Alzheimer's Disease.
Estimating a common covariance matrix for network meta-analysis of gene expression datasets in diffuse large B-cell lymphoma
Aug 21, 2017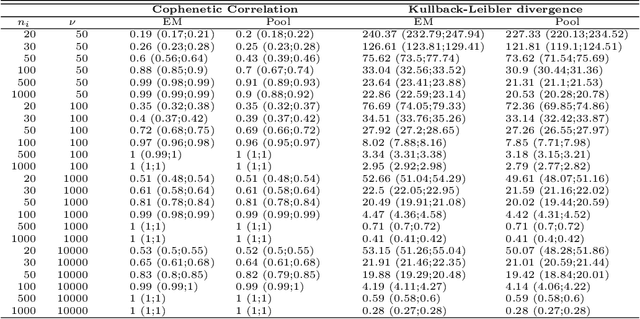

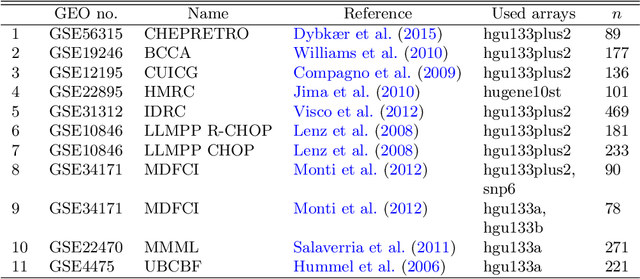
Abstract:The estimation of covariance matrices of gene expressions has many applications in cancer systems biology. Many gene expression studies, however, are hampered by low sample size and it has therefore become popular to increase sample size by collecting gene expression data across studies. Motivated by the traditional meta-analysis using random effects models, we present a hierarchical random covariance model and use it for the meta-analysis of gene correlation networks across 11 large-scale gene expression studies of diffuse large B-cell lymphoma (DLBCL). We suggest to use a maximum likelihood estimator for the underlying common covariance matrix and introduce an EM algorithm for estimation. By simulation experiments comparing the estimated covariance matrices by cophenetic correlation and Kullback-Leibler divergence the suggested estimator showed to perform better or not worse than a simple pooled estimator. In a posthoc analysis of the estimated common covariance matrix for the DLBCL data we were able to identify novel biologically meaningful gene correlation networks with eigengenes of prognostic value. In conclusion, the method seems to provide a generally applicable framework for meta-analysis, when multiple features are measured and believed to share a common covariance matrix obscured by study dependent noise.
Targeted Fused Ridge Estimation of Inverse Covariance Matrices from Multiple High-Dimensional Data Classes
Sep 26, 2015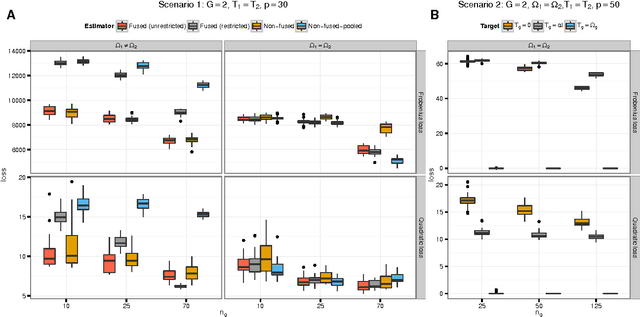
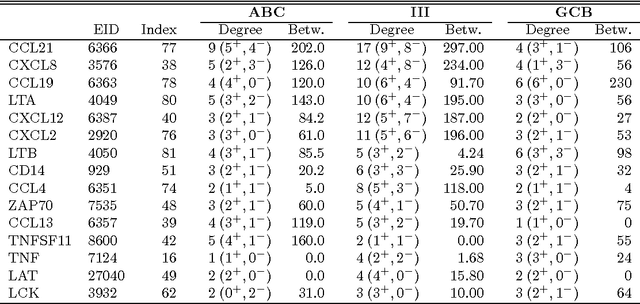
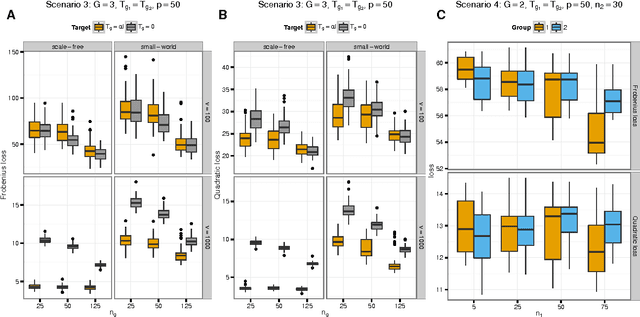
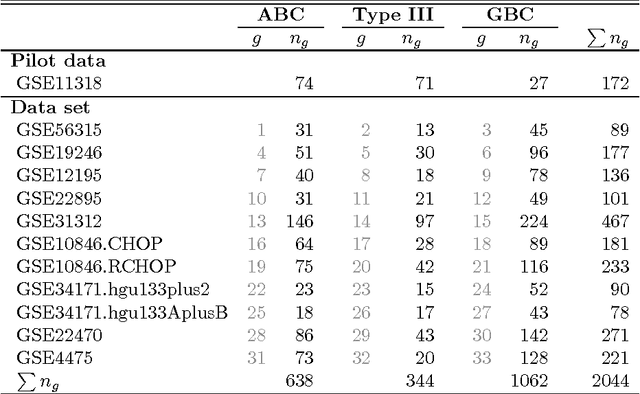
Abstract:We consider the problem of jointly estimating multiple precision matrices from (aggregated) high-dimensional data consisting of distinct classes. An $\ell_2$-penalized maximum-likelihood approach is employed. The suggested approach is flexible and generic, incorporating several other $\ell_2$-penalized estimators as special cases. In addition, the approach allows for the specification of target matrices through which prior knowledge may be incorporated and which can stabilize the estimation procedure in high-dimensional settings. The result is a targeted fused ridge estimator that is of use when the precision matrices of the constituent classes are believed to chiefly share the same structure while potentially differing in a number of locations of interest. It has many applications in (multi)factorial study designs. We focus on the graphical interpretation of precision matrices with the proposed estimator then serving as a basis for integrative or meta-analytic Gaussian graphical modeling. Situations are considered in which the classes are defined by data sets and/or (subtypes of) diseases. The performance of the proposed estimator in the graphical modeling setting is assessed through extensive simulation experiments. Its practical usability is illustrated by the differential network modeling of 11 large-scale diffuse large B-cell lymphoma gene expression data sets. The estimator and its related procedures are incorporated into the R-package rags2ridges.
 Add to Chrome
 Add to Firefox
 Add to Edge