Amy McGovern
A Diffusion-Based Framework for High-Resolution Precipitation Forecasting over CONUS
Dec 09, 2025Abstract:Accurate precipitation forecasting is essential for hydrometeorological risk management, especially for anticipating extreme rainfall that can lead to flash flooding and infrastructure damage. This study introduces a diffusion-based deep learning (DL) framework that systematically compares three residual prediction strategies differing only in their input sources: (1) a fully data-driven model using only past observations from the Multi-Radar Multi-Sensor (MRMS) system, (2) a corrective model using only forecasts from the High-Resolution Rapid Refresh (HRRR) numerical weather prediction system, and (3) a hybrid model integrating both MRMS and selected HRRR forecast variables. By evaluating these approaches under a unified setup, we provide a clearer understanding of how each data source contributes to predictive skill over the Continental United States (CONUS). Forecasts are produced at 1-km spatial resolution, beginning with direct 1-hour predictions and extending to 12 hours using autoregressive rollouts. Performance is evaluated using both CONUS-wide and region-specific metrics that assess overall performance and skill at extreme rainfall thresholds. Across all lead times, our DL framework consistently outperforms the HRRR baseline in pixel-wise and spatiostatistical metrics. The hybrid model performs best at the shortest lead time, while the HRRR-corrective model outperforms others at longer lead times, maintaining high skill through 12 hours. To assess reliability, we incorporate calibrated uncertainty quantification tailored to the residual learning setup. These gains, particularly at longer lead times, are critical for emergency preparedness, where modest increases in forecast horizon can improve decision-making. This work advances DL-based precipitation forecasting by enhancing predictive skill, reliability, and applicability across regions.
Oya: Deep Learning for Accurate Global Precipitation Estimation
Nov 13, 2025Abstract:Accurate precipitation estimation is critical for hydrological applications, especially in the Global South where ground-based observation networks are sparse and forecasting skill is limited. Existing satellite-based precipitation products often rely on the longwave infrared channel alone or are calibrated with data that can introduce significant errors, particularly at sub-daily timescales. This study introduces Oya, a novel real-time precipitation retrieval algorithm utilizing the full spectrum of visible and infrared (VIS-IR) observations from geostationary (GEO) satellites. Oya employs a two-stage deep learning approach, combining two U-Net models: one for precipitation detection and another for quantitative precipitation estimation (QPE), to address the inherent data imbalance between rain and no-rain events. The models are trained using high-resolution GPM Combined Radar-Radiometer Algorithm (CORRA) v07 data as ground truth and pre-trained on IMERG-Final retrievals to enhance robustness and mitigate overfitting due to the limited temporal sampling of CORRA. By leveraging multiple GEO satellites, Oya achieves quasi-global coverage and demonstrates superior performance compared to existing competitive regional and global precipitation baselines, offering a promising pathway to improved precipitation monitoring and forecasting.
Machine Learning Estimation of Maximum Vertical Velocity from Radar
Oct 13, 2023Abstract:Despite being the source region of severe weather hazards, the quantification of the fast current of upward moving air (i.e., updraft) remains unavailable for operational forecasting. Updraft proxies, like overshooting top area from satellite images, have been linked to severe weather hazards but only relate to a limited portion of the total storm updraft. This study investigates if a machine learning model, namely U-Nets, can skillfully retrieve maximum vertical velocity and its areal extent from 3-dimensional (3D) gridded radar reflectivity alone. The machine learning model is trained using simulated radar reflectivity and vertical velocity from the National Severe Storm Laboratory's convection permitting Warn on Forecast System (WoFS). A parametric regression technique using the Sinh-arcsinh-normal (SHASH) distribution is adapted to run with UNets, allowing for both deterministic and probabilistic predictions of maximum vertical velocity. The best models after hyperparameter search provided less than 50% root mean squared error, a coefficient of determination greater than 0.65 and an intersection over union (IoU) of more than 0.45 on the independent test set composed of WoFS data. Beyond the WoFS analysis, a case study was conducted using real radar data and corresponding dual-Doppler analyses of vertical velocity within a supercell. The U-Net consistently underestimates the dual-Doppler updraft speed estimates by 50%. Meanwhile, the area of the 5 and 10 m s-1 updraft cores show an IoU of 0.25. While the above statistics are not exceptional, the machine learning model enables quick distillation of 3D radar data that is related to the maximum vertical velocity which could be useful in assessing a storm's severe potential.
Comparing Explanation Methods for Traditional Machine Learning Models Part 2: Quantifying Model Explainability Faithfulness and Improvements with Dimensionality Reduction
Nov 18, 2022Abstract:Machine learning (ML) models are becoming increasingly common in the atmospheric science community with a wide range of applications. To enable users to understand what an ML model has learned, ML explainability has become a field of active research. In Part I of this two-part study, we described several explainability methods and demonstrated that feature rankings from different methods can substantially disagree with each other. It is unclear, though, whether the disagreement is overinflated due to some methods being less faithful in assigning importance. Herein, "faithfulness" or "fidelity" refer to the correspondence between the assigned feature importance and the contribution of the feature to model performance. In the present study, we evaluate the faithfulness of feature ranking methods using multiple methods. Given the sensitivity of explanation methods to feature correlations, we also quantify how much explainability faithfulness improves after correlated features are limited. Before dimensionality reduction, the feature relevance methods [e.g., SHAP, LIME, ALE variance, and logistic regression (LR) coefficients] were generally more faithful than the permutation importance methods due to the negative impact of correlated features. Once correlated features were reduced, traditional permutation importance became the most faithful method. In addition, the ranking uncertainty (i.e., the spread in rank assigned to a feature by the different ranking methods) was reduced by a factor of 2-10, and excluding less faithful feature ranking methods reduces it further. This study is one of the first to quantify the improvement in explainability from limiting correlated features and knowing the relative fidelity of different explainability methods.
Comparing Explanation Methods for Traditional Machine Learning Models Part 1: An Overview of Current Methods and Quantifying Their Disagreement
Nov 16, 2022Abstract:With increasing interest in explaining machine learning (ML) models, the first part of this two-part study synthesizes recent research on methods for explaining global and local aspects of ML models. This study distinguishes explainability from interpretability, local from global explainability, and feature importance versus feature relevance. We demonstrate and visualize different explanation methods, how to interpret them, and provide a complete Python package (scikit-explain) to allow future researchers to explore these products. We also highlight the frequent disagreement between explanation methods for feature rankings and feature effects and provide practical advice for dealing with these disagreements. We used ML models developed for severe weather prediction and sub-freezing road surface temperature prediction to generalize the behavior of the different explanation methods. For feature rankings, there is substantially more agreement on the set of top features (e.g., on average, two methods agree on 6 of the top 10 features) than on specific rankings (on average, two methods only agree on the ranks of 2-3 features in the set of top 10 features). On the other hand, two feature effect curves from different methods are in high agreement as long as the phase space is well sampled. Finally, a lesser-known method, tree interpreter, was found comparable to SHAP for feature effects, and with the widespread use of random forests in geosciences and computational ease of tree interpreter, we recommend it be explored in future research.
A Machine Learning Tutorial for Operational Meteorology, Part II: Neural Networks and Deep Learning
Oct 31, 2022


Abstract:Over the past decade the use of machine learning in meteorology has grown rapidly. Specifically neural networks and deep learning have been being used at an unprecedented rate. In order to fill the dearth of resources covering neural networks with a meteorological lens, this paper discusses machine learning methods in a plain language format that is targeted for the operational meteorolgical community. This is the second paper in a pair that aim to serve as a machine learning resource for meteorologists. While the first paper focused on traditional machine learning methods (e.g., random forest), here a broad spectrum of neural networks and deep learning methods are discussed. Specifically this paper covers perceptrons, artificial neural networks, convolutional neural networks and U-networks. Like the part 1 paper, this manuscript discusses the terms associated with neural networks and their training. Then the manuscript provides some intuition behind every method and concludes by showing each method used in a meteorological example of diagnosing thunderstorms from satellite images (e.g., lightning flashes). This paper is accompanied by an open-source code repository to allow readers to explore neural networks using either the dataset provided (which is used in the paper) or as a template for alternate datasets.
Global Extreme Heat Forecasting Using Neural Weather Models
May 23, 2022
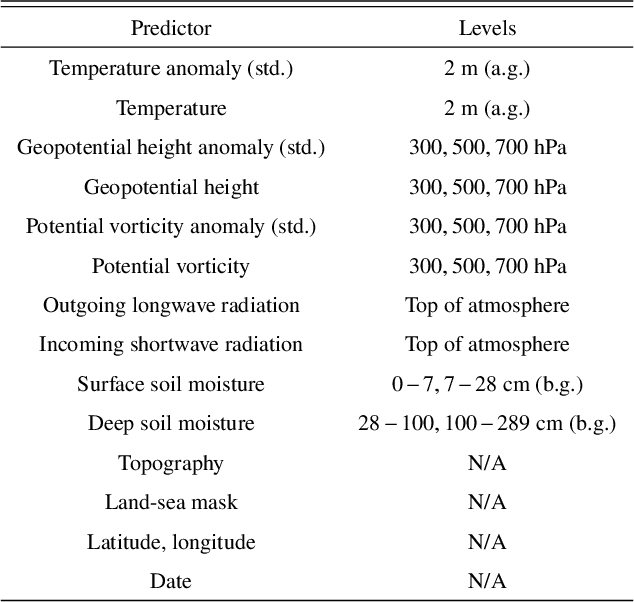
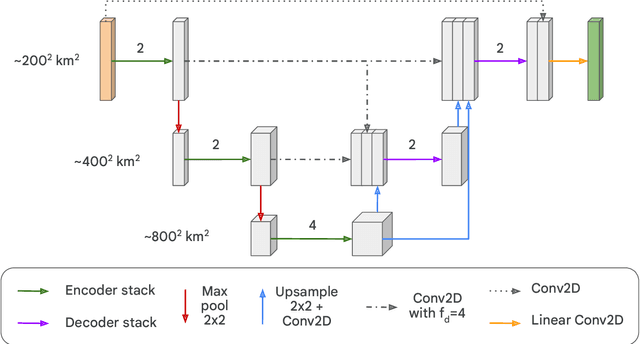
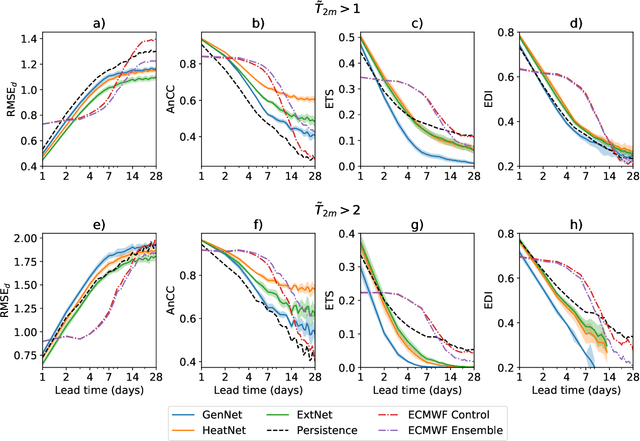
Abstract:Heat waves are projected to increase in frequency and severity with global warming. Improved warning systems would help reduce the associated loss of lives, wildfires, power disruptions, and reduction in crop yields. In this work, we explore the potential for deep learning systems trained on historical data to forecast extreme heat on short, medium and subseasonal timescales. To this purpose, we train a set of neural weather models (NWMs) with convolutional architectures to forecast surface temperature anomalies globally, 1 to 28 days ahead, at $\sim200~\mathrm{km}$ resolution and on the cubed sphere. The NWMs are trained using the ERA5 reanalysis product and a set of candidate loss functions, including the mean squared error and exponential losses targeting extremes. We find that training models to minimize custom losses tailored to emphasize extremes leads to significant skill improvements in the heat wave prediction task, compared to NWMs trained on the mean squared error loss. This improvement is accomplished with almost no skill reduction in the general temperature prediction task, and it can be efficiently realized through transfer learning, by re-training NWMs with the custom losses for a few epochs. In addition, we find that the use of a symmetric exponential loss reduces the smoothing of NWM forecasts with lead time. Our best NWM is able to outperform persistence in a regressive sense for all lead times and temperature anomaly thresholds considered, and shows positive regressive skill compared to the ECMWF subseasonal-to-seasonal control forecast within the first two forecast days and after two weeks.
A Machine Learning Tutorial for Operational Meteorology, Part I: Traditional Machine Learning
Apr 15, 2022


Abstract:Recently, the use of machine learning in meteorology has increased greatly. While many machine learning methods are not new, university classes on machine learning are largely unavailable to meteorology students and are not required to become a meteorologist. The lack of formal instruction has contributed to perception that machine learning methods are 'black boxes' and thus end-users are hesitant to apply the machine learning methods in their every day workflow. To reduce the opaqueness of machine learning methods and lower hesitancy towards machine learning in meteorology, this paper provides a survey of some of the most common machine learning methods. A familiar meteorological example is used to contextualize the machine learning methods while also discussing machine learning topics using plain language. The following machine learning methods are demonstrated: linear regression; logistic regression; decision trees; random forest; gradient boosted decision trees; naive Bayes; and support vector machines. Beyond discussing the different methods, the paper also contains discussions on the general machine learning process as well as best practices to enable readers to apply machine learning to their own datasets. Furthermore, all code (in the form of Jupyter notebooks and Google Colaboratory notebooks) used to make the examples in the paper is provided in an effort to catalyse the use of machine learning in meteorology.
The Need for Ethical, Responsible, and Trustworthy Artificial Intelligence for Environmental Sciences
Dec 15, 2021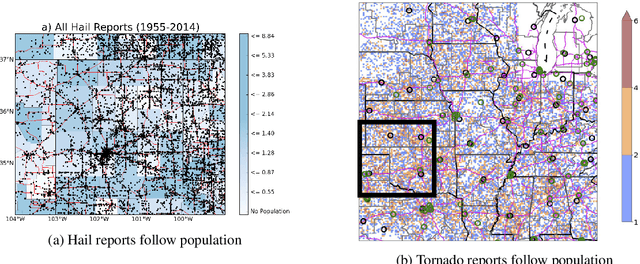
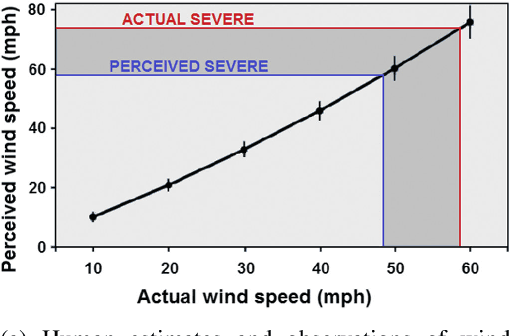
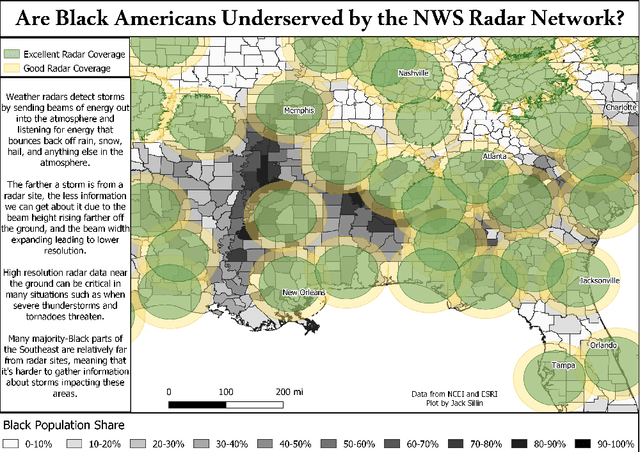
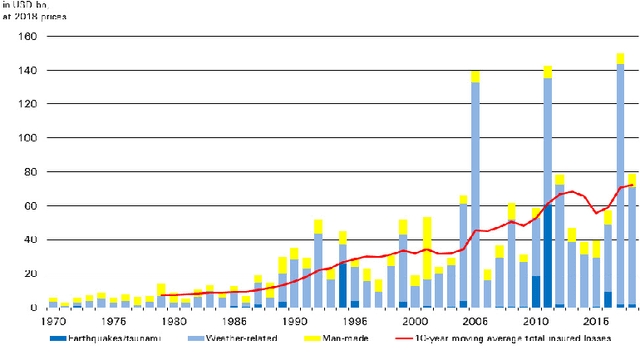
Abstract:Given the growing use of Artificial Intelligence (AI) and machine learning (ML) methods across all aspects of environmental sciences, it is imperative that we initiate a discussion about the ethical and responsible use of AI. In fact, much can be learned from other domains where AI was introduced, often with the best of intentions, yet often led to unintended societal consequences, such as hard coding racial bias in the criminal justice system or increasing economic inequality through the financial system. A common misconception is that the environmental sciences are immune to such unintended consequences when AI is being used, as most data come from observations, and AI algorithms are based on mathematical formulas, which are often seen as objective. In this article, we argue the opposite can be the case. Using specific examples, we demonstrate many ways in which the use of AI can introduce similar consequences in the environmental sciences. This article will stimulate discussion and research efforts in this direction. As a community, we should avoid repeating any foreseeable mistakes made in other domains through the introduction of AI. In fact, with proper precautions, AI can be a great tool to help {\it reduce} climate and environmental injustice. We primarily focus on weather and climate examples but the conclusions apply broadly across the environmental sciences.
Using Machine Learning to Calibrate Storm-Scale Probabilistic Guidance of Severe Weather Hazards in the Warn-on-Forecast System
Nov 12, 2020
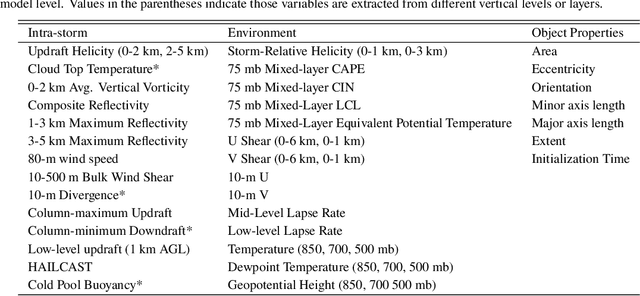
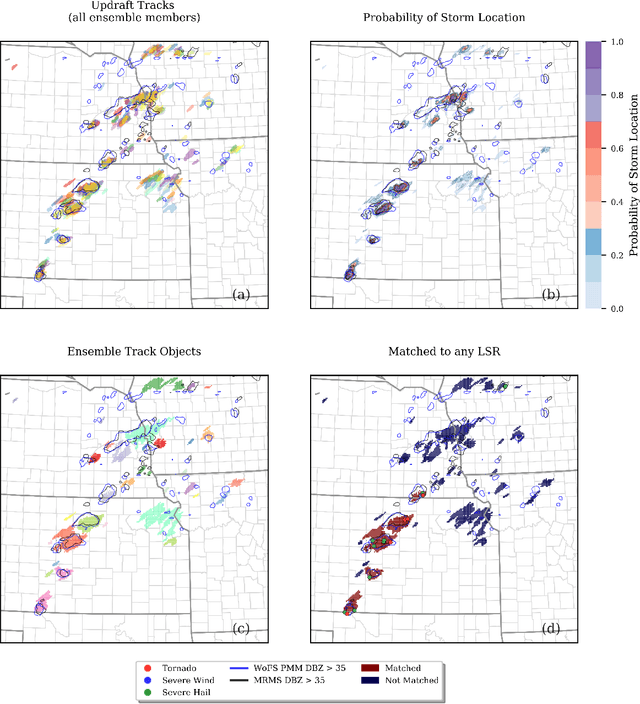
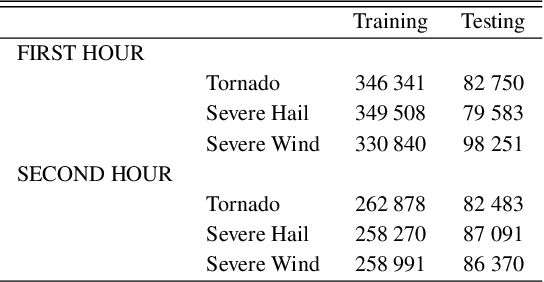
Abstract:A primary goal of the National Oceanic and Atmospheric Administration (NOAA) Warn-on-Forecast (WoF) project is to provide rapidly updating probabilistic guidance to human forecasters for short-term (e.g., 0-3 h) severe weather forecasts. Maximizing the usefulness of probabilistic severe weather guidance from an ensemble of convection-allowing model forecasts requires calibration. In this study, we compare the skill of a simple method using updraft helicity against a series of machine learning (ML) algorithms for calibrating WoFS severe weather guidance. ML models are often used to calibrate severe weather guidance since they leverage multiple variables and discover useful patterns in complex datasets. \indent Our dataset includes WoF System (WoFS) ensemble forecasts available every 5 minutes out to 150 min of lead time from the 2017-2019 NOAA Hazardous Weather Testbed Spring Forecasting Experiments (81 dates). Using a novel ensemble storm track identification method, we extracted three sets of predictors from the WoFS forecasts: intra-storm state variables, near-storm environment variables, and morphological attributes of the ensemble storm tracks. We then trained random forests, gradient-boosted trees, and logistic regression algorithms to predict which WoFS 30-min ensemble storm tracks will correspond to a tornado, severe hail, and/or severe wind report. For the simple method, we extracted the ensemble probability of 2-5 km updraft helicity (UH) exceeding a threshold (tuned per severe weather hazard) from each ensemble storm track. The three ML algorithms discriminated well for all three hazards and produced more reliable probabilities than the UH-based predictions. Overall, the results suggest that ML-based calibrations of dynamical ensemble output can improve short term, storm-scale severe weather probabilistic guidance
 Add to Chrome
 Add to Firefox
 Add to Edge