EXPLAINABOARD: An Explainable Leaderboard for NLP
Paper and Code
Apr 13, 2021


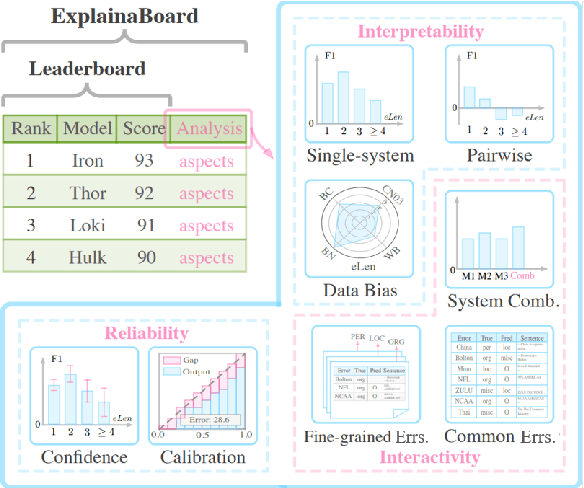
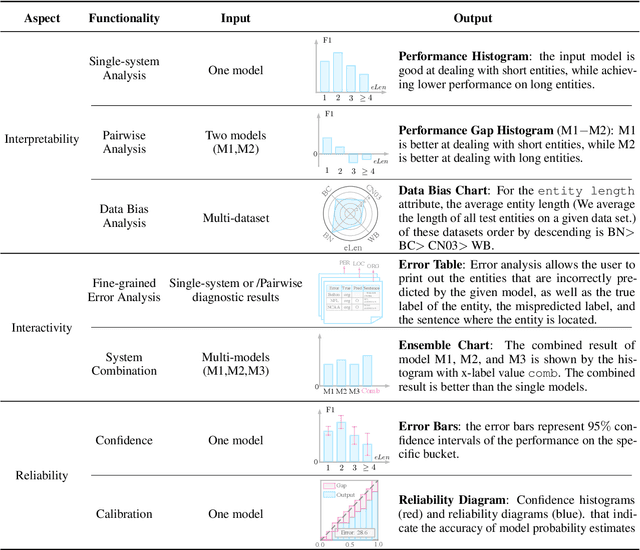
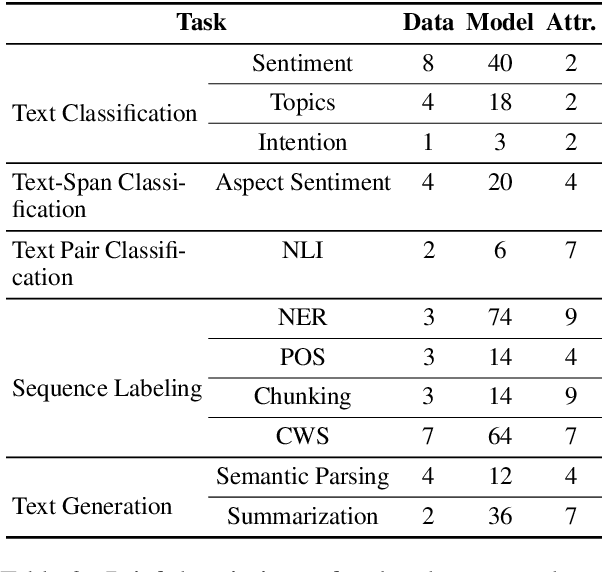
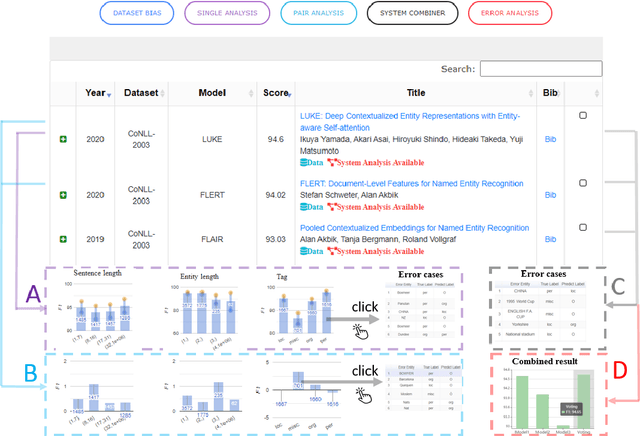
With the rapid development of NLP research, leaderboards have emerged as one tool to track the performance of various systems on various NLP tasks. They are effective in this goal to some extent, but generally present a rather simplistic one-dimensional view of the submitted systems, communicated only through holistic accuracy numbers. In this paper, we present a new conceptualization and implementation of NLP evaluation: the ExplainaBoard, which in addition to inheriting the functionality of the standard leaderboard, also allows researchers to (i) diagnose strengths and weaknesses of a single system (e.g. what is the best-performing system bad at?) (ii) interpret relationships between multiple systems. (e.g. where does system A outperform system B? What if we combine systems A, B, C?) and (iii) examine prediction results closely (e.g. what are common errors made by multiple systems or and in what contexts do particular errors occur?). ExplainaBoard has been deployed at \url{http://explainaboard.nlpedia.ai/}, and we have additionally released our interpretable evaluation code at \url{https://github.com/neulab/ExplainaBoard} and output files from more than 300 systems, 40 datasets, and 9 tasks to motivate the "output-driven" research in the future.
 Add to Chrome
 Add to Firefox
 Add to Edge