Vangelis Marinakis
Integrating Dynamic Correlation Shifts and Weighted Benchmarking in Extreme Value Analysis
Nov 19, 2024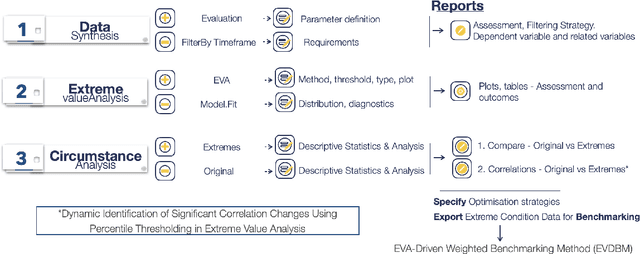
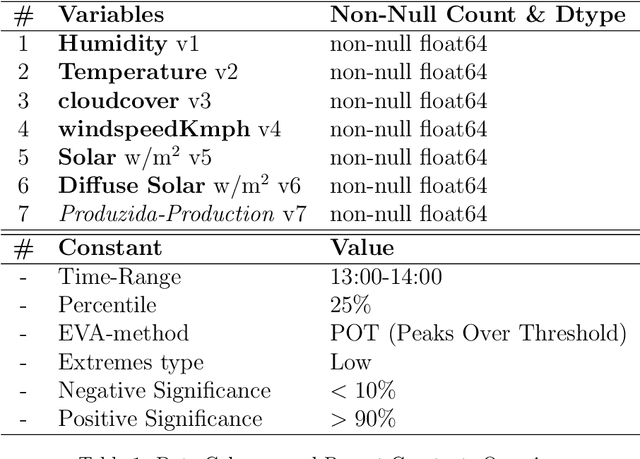
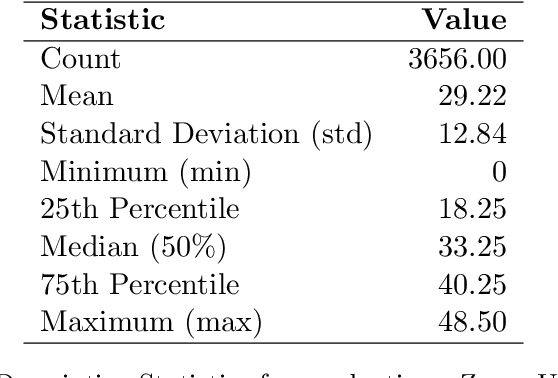
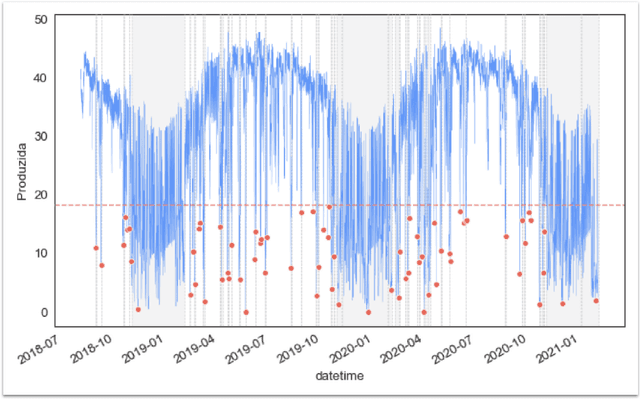
Abstract:This paper presents an innovative approach to Extreme Value Analysis (EVA) by introducing the Extreme Value Dynamic Benchmarking Method (EVDBM). EVDBM integrates extreme value theory to detect extreme events and is coupled with the novel Dynamic Identification of Significant Correlation (DISC)-Thresholding algorithm, which enhances the analysis of key variables under extreme conditions. By integrating return values predicted through EVA into the benchmarking scores, we are able to transform these scores to reflect anticipated conditions more accurately. This provides a more precise picture of how each case is projected to unfold under extreme conditions. As a result, the adjusted scores offer a forward-looking perspective, highlighting potential vulnerabilities and resilience factors for each case in a way that static historical data alone cannot capture. By incorporating both historical and probabilistic elements, the EVDBM algorithm provides a comprehensive benchmarking framework that is adaptable to a range of scenarios and contexts. The methodology is applied to real PV data, revealing critical low - production scenarios and significant correlations between variables, which aid in risk management, infrastructure design, and long-term planning, while also allowing for the comparison of different production plants. The flexibility of EVDBM suggests its potential for broader applications in other sectors where decision-making sensitivity is crucial, offering valuable insights to improve outcomes.
A multi-dimensional unsupervised machine learning framework for clustering residential heat load profiles
Nov 11, 2024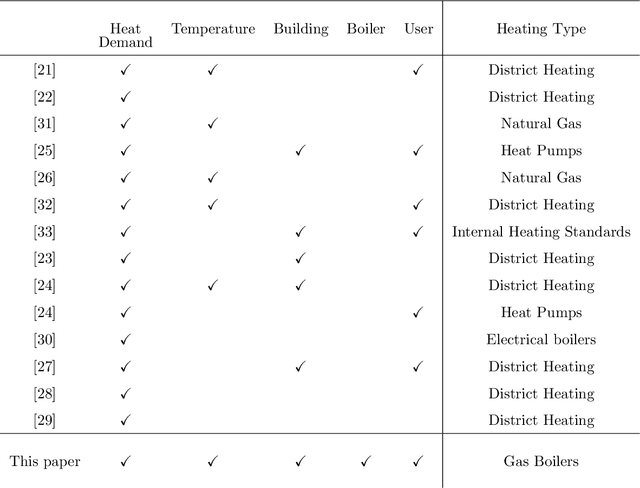


Abstract:Central to achieving the energy transition, heating systems provide essential space heating and hot water in residential and industrial environments. A major challenge lies in effectively profiling large clusters of buildings to improve demand estimation and enable efficient Demand Response (DR) schemes. This paper addresses this challenge by introducing an unsupervised machine learning framework for clustering residential heating load profiles, focusing on natural gas space heating and hot water preparation boilers. The profiles are analyzed across five dimensions: boiler usage, heating demand, weather conditions, building characteristics, and user behavior. We apply three distance metrics: Euclidean Distance (ED), Dynamic Time Warping (DTW), and Derivative Dynamic Time Warping (DDTW), and evaluate their performance using established clustering indices. The proposed method is assessed considering 29 residential buildings in Greece equipped with smart meters throughout a calendar heating season (i.e., 210 days). Results indicate that DTW is the most suitable metric, uncovering strong correlations between boiler usage, heat demand, and temperature, while ED highlights broader interrelations across dimensions and DDTW proves less effective, resulting in weaker clusters. These findings offer key insights into heating load behavior, establishing a solid foundation for developing more targeted and effective DR programs.
A Machine Learning-Based Framework for Clustering Residential Electricity Load Profiles to Enhance Demand Response Programs
Oct 31, 2023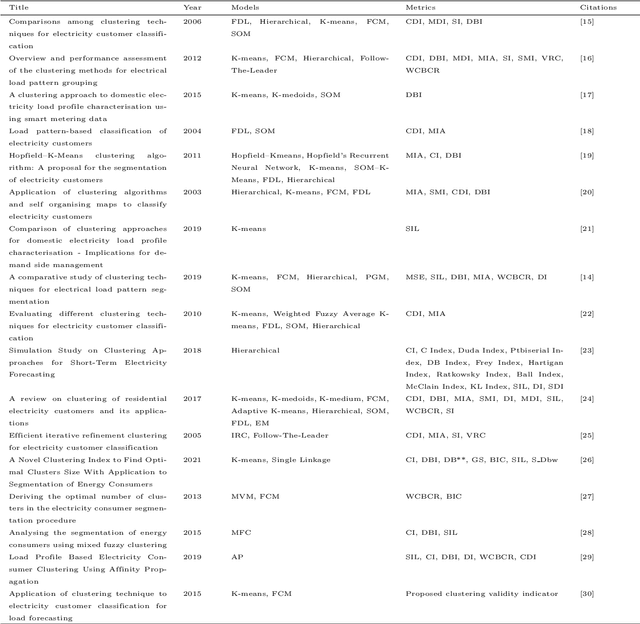

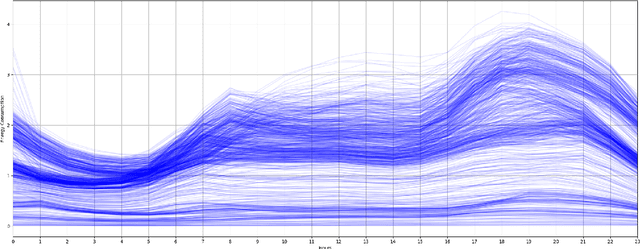

Abstract:Load shapes derived from smart meter data are frequently employed to analyze daily energy consumption patterns, particularly in the context of applications like Demand Response (DR). Nevertheless, one of the most important challenges to this endeavor lies in identifying the most suitable consumer clusters with similar consumption behaviors. In this paper, we present a novel machine learning based framework in order to achieve optimal load profiling through a real case study, utilizing data from almost 5000 households in London. Four widely used clustering algorithms are applied specifically K-means, K-medoids, Hierarchical Agglomerative Clustering and Density-based Spatial Clustering. An empirical analysis as well as multiple evaluation metrics are leveraged to assess those algorithms. Following that, we redefine the problem as a probabilistic classification one, with the classifier emulating the behavior of a clustering algorithm,leveraging Explainable AI (xAI) to enhance the interpretability of our solution. According to the clustering algorithm analysis the optimal number of clusters for this case is seven. Despite that, our methodology shows that two of the clusters, almost 10\% of the dataset, exhibit significant internal dissimilarity and thus it splits them even further to create nine clusters in total. The scalability and versatility of our solution makes it an ideal choice for power utility companies aiming to segment their users for creating more targeted Demand Response programs.
 Add to Chrome
 Add to Firefox
 Add to Edge