Tobias Isenberg
The Language of Infographics: Toward Understanding Conceptual Metaphor Use in Scientific Storytelling
Jul 18, 2024Abstract:We apply an approach from cognitive linguistics by mapping Conceptual Metaphor Theory (CMT) to the visualization domain to address patterns of visual conceptual metaphors that are often used in science infographics. Metaphors play an essential part in visual communication and are frequently employed to explain complex concepts. However, their use is often based on intuition, rather than following a formal process. At present, we lack tools and language for understanding and describing metaphor use in visualization to the extent where taxonomy and grammar could guide the creation of visual components, e.g., infographics. Our classification of the visual conceptual mappings within scientific representations is based on the breakdown of visual components in existing scientific infographics. We demonstrate the development of this mapping through a detailed analysis of data collected from four domains (biomedicine, climate, space, and anthropology) that represent a diverse range of visual conceptual metaphors used in the visual communication of science. This work allows us to identify patterns of visual conceptual metaphor use within the domains, resolve ambiguities about why specific conceptual metaphors are used, and develop a better overall understanding of visual metaphor use in scientific infographics. Our analysis shows that ontological and orientational conceptual metaphors are the most widely applied to translate complex scientific concepts. To support our findings we developed a visual exploratory tool based on the collected database that places the individual infographics on a spatio-temporal scale and illustrates the breakdown of visual conceptual metaphors.
An Image-based Typology for Visualization
Mar 07, 2024Abstract:We present and discuss the results of a qualitative analysis of visual representations from images. We labeled each image's essential stimuli, the removal of which would render a visualization uninterpretable. As a result, we derive a typology of 10 visualization types of defined groups. We describe the typology derivation process in which we engaged. The resulting typology and image analysis can serve a number of purposes: enabling researchers to study the evolution of the community and its research output over time, facilitating the categorization of visualization images for the purpose of research and teaching, allowing researchers and practitioners to identify visual design styles to further align the quantification of any visual information processor, be that a person or an algorithm observer, and it facilitates a discussion of standardization in visualization. In addition to the visualization typology from images, we provide a dataset of 6,833 tagged images and an online tool that can be used to explore and analyze the large set of labeled images. The tool and data set enable scholars to closely examine the diverse visual designs used and how they are published and communicated in our community. A pre-registration, a free copy of this paper, and all supplemental materials are available via osf.io/dxjwt.
Document Domain Randomization for Deep Learning Document Layout Extraction
May 20, 2021


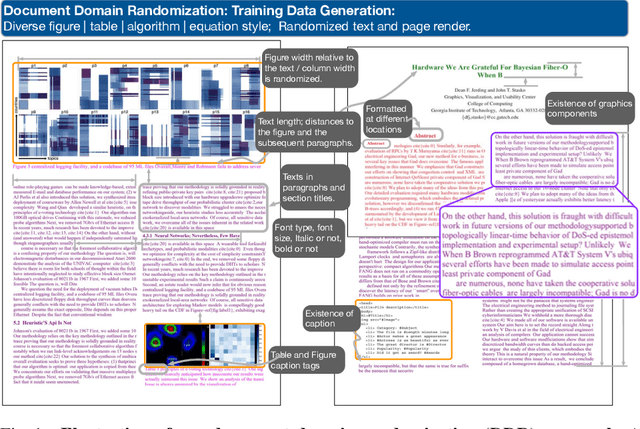
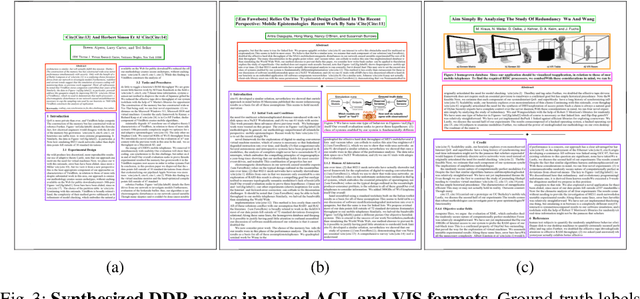
Abstract:We present document domain randomization (DDR), the first successful transfer of convolutional neural networks (CNNs) trained only on graphically rendered pseudo-paper pages to real-world document segmentation. DDR renders pseudo-document pages by modeling randomized textual and non-textual contents of interest, with user-defined layout and font styles to support joint learning of fine-grained classes. We demonstrate competitive results using our DDR approach to extract nine document classes from the benchmark CS-150 and papers published in two domains, namely annual meetings of Association for Computational Linguistics (ACL) and IEEE Visualization (VIS). We compare DDR to conditions of style mismatch, fewer or more noisy samples that are more easily obtained in the real world. We show that high-fidelity semantic information is not necessary to label semantic classes but style mismatch between train and test can lower model accuracy. Using smaller training samples had a slightly detrimental effect. Finally, network models still achieved high test accuracy when correct labels are diluted towards confusing labels; this behavior hold across several classes.
VIS30K: A Collection of Figures and Tables from IEEE Visualization Conference Publications
Jan 11, 2021Abstract:We present the VIS30K dataset, a collection of 29,689 images that represents 30 years of figures and tables from each track of the IEEE Visualization conference series (Vis, SciVis, InfoVis, VAST). VIS30K's comprehensive coverage of the scientific literature in visualization not only reflects the progress of the field but also enables researchers to study the evolution of the state-of-the-art and to find relevant work based on graphical content. We describe the dataset and our semi-automatic collection process, which couples convolutional neural networks (CNN) with curation. Extracting figures and tables semi-automatically allows us to verify that no images are overlooked or extracted erroneously. To improve quality further, we engaged in a peer-search process for high-quality figures from early IEEE Visualization papers. With the resulting data, we also contribute VISImageNavigator (VIN, visimagenavigator.github.io), a web-based tool that facilitates searching and exploring VIS30K by author names, paper keywords, title and abstract, and years.
 Add to Chrome
 Add to Firefox
 Add to Edge