Po-shen Lee
Delineating Knowledge Domains in the Scientific Literature Using Visual Information
Aug 12, 2019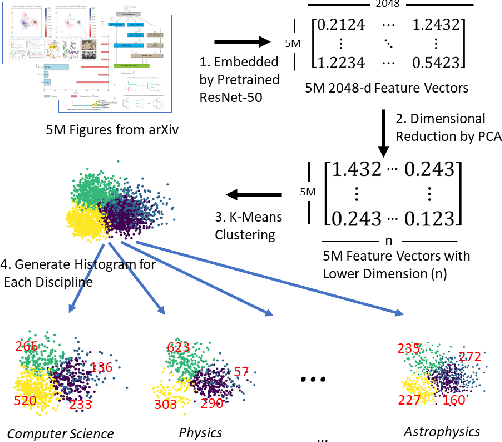

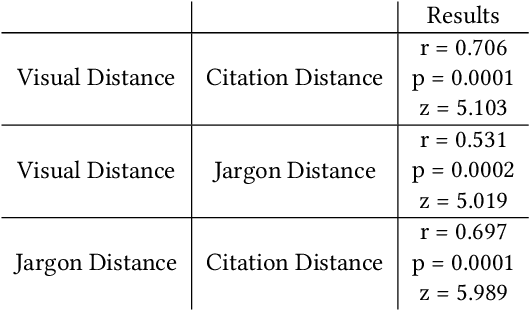
Abstract:Figures are an important channel for scientific communication, used to express complex ideas, models and data in ways that words cannot. However, this visual information is mostly ignored in analyses of the scientific literature. In this paper, we demonstrate the utility of using scientific figures as markers of knowledge domains in science, which can be used for classification, recommender systems, and studies of scientific information exchange. We encode sets of images into a visual signature, then use distances between these signatures to understand how patterns of visual communication compare with patterns of jargon and citation structures. We find that figures can be as effective for differentiating communities of practice as text or citation patterns. We then consider where these metrics disagree to understand how different disciplines use visualization to express ideas. Finally, we further consider how specific figure types propagate through the literature, suggesting a new mechanism for understanding the flow of ideas apart from conventional channels of text and citations. Our ultimate aim is to better leverage these information-dense objects to improve scientific communication across disciplinary boundaries.
Viziometrics: Analyzing Visual Information in the Scientific Literature
May 27, 2016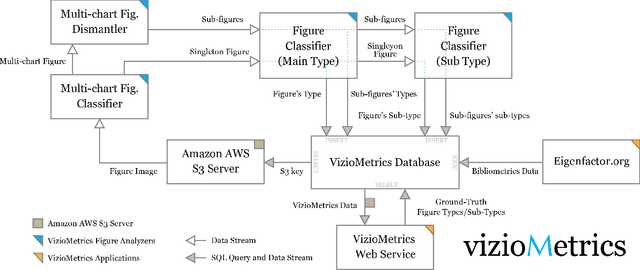


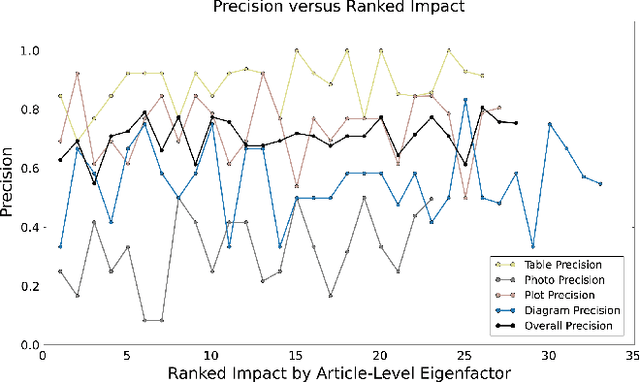
Abstract:Scientific results are communicated visually in the literature through diagrams, visualizations, and photographs. These information-dense objects have been largely ignored in bibliometrics and scientometrics studies when compared to citations and text. In this paper, we use techniques from computer vision and machine learning to classify more than 8 million figures from PubMed into 5 figure types and study the resulting patterns of visual information as they relate to impact. We find that the distribution of figures and figure types in the literature has remained relatively constant over time, but can vary widely across field and topic. Remarkably, we find a significant correlation between scientific impact and the use of visual information, where higher impact papers tend to include more diagrams, and to a lesser extent more plots and photographs. To explore these results and other ways of extracting this visual information, we have built a visual browser to illustrate the concept and explore design alternatives for supporting viziometric analysis and organizing visual information. We use these results to articulate a new research agenda -- viziometrics -- to study the organization and presentation of visual information in the scientific literature.
 Add to Chrome
 Add to Firefox
 Add to Edge