Lautaro Dolberg
Large-Scale Detection of Non-Technical Losses in Imbalanced Data Sets
Jul 25, 2017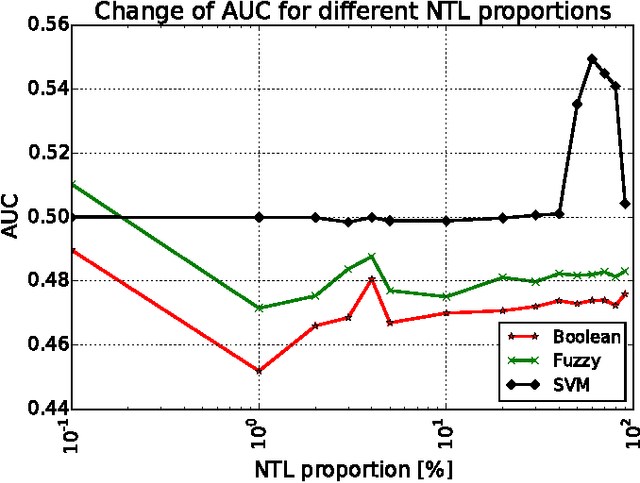
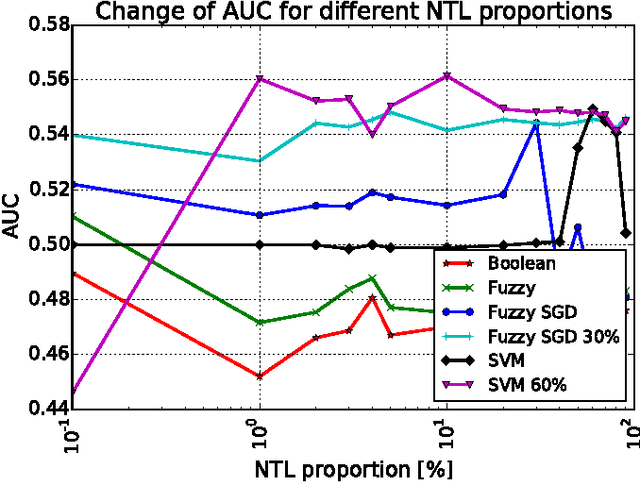
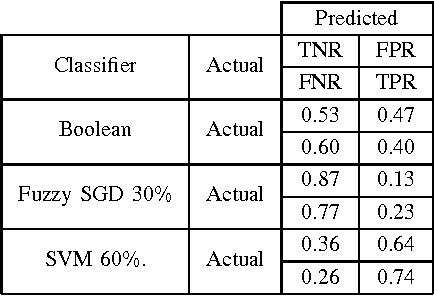
Abstract:Non-technical losses (NTL) such as electricity theft cause significant harm to our economies, as in some countries they may range up to 40% of the total electricity distributed. Detecting NTLs requires costly on-site inspections. Accurate prediction of NTLs for customers using machine learning is therefore crucial. To date, related research largely ignore that the two classes of regular and non-regular customers are highly imbalanced, that NTL proportions may change and mostly consider small data sets, often not allowing to deploy the results in production. In this paper, we present a comprehensive approach to assess three NTL detection models for different NTL proportions in large real world data sets of 100Ks of customers: Boolean rules, fuzzy logic and Support Vector Machine. This work has resulted in appreciable results that are about to be deployed in a leading industry solution. We believe that the considerations and observations made in this contribution are necessary for future smart meter research in order to report their effectiveness on imbalanced and large real world data sets.
Neighborhood Features Help Detecting Non-Technical Losses in Big Data Sets
Jul 25, 2017
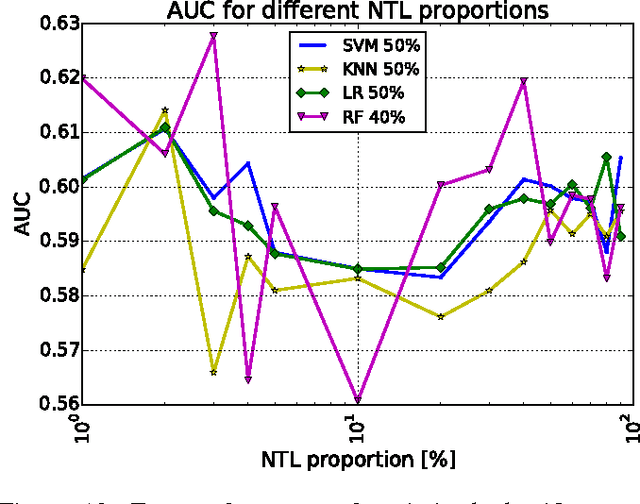
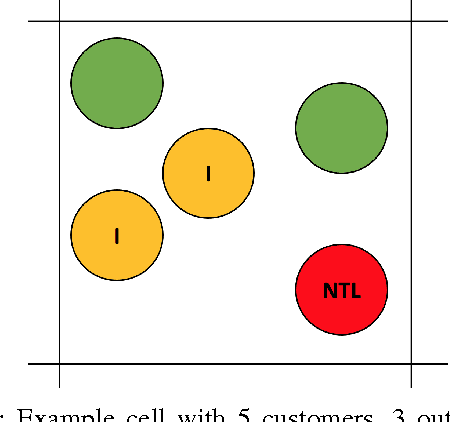
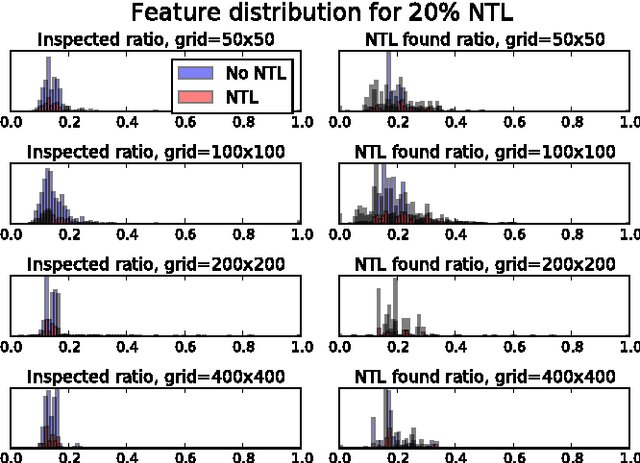
Abstract:Electricity theft is a major problem around the world in both developed and developing countries and may range up to 40% of the total electricity distributed. More generally, electricity theft belongs to non-technical losses (NTL), which are losses that occur during the distribution of electricity in power grids. In this paper, we build features from the neighborhood of customers. We first split the area in which the customers are located into grids of different sizes. For each grid cell we then compute the proportion of inspected customers and the proportion of NTL found among the inspected customers. We then analyze the distributions of features generated and show why they are useful to predict NTL. In addition, we compute features from the consumption time series of customers. We also use master data features of customers, such as their customer class and voltage of their connection. We compute these features for a Big Data base of 31M meter readings, 700K customers and 400K inspection results. We then use these features to train four machine learning algorithms that are particularly suitable for Big Data sets because of their parallelizable structure: logistic regression, k-nearest neighbors, linear support vector machine and random forest. Using the neighborhood features instead of only analyzing the time series has resulted in appreciable results for Big Data sets for varying NTL proportions of 1%-90%. This work can therefore be deployed to a wide range of different regions around the world.
 Add to Chrome
 Add to Firefox
 Add to Edge