Kaustav Basu
The Cardinality of Identifying Code Sets for Soccer Ball Graph with Application to Remote Sensing
Jul 19, 2024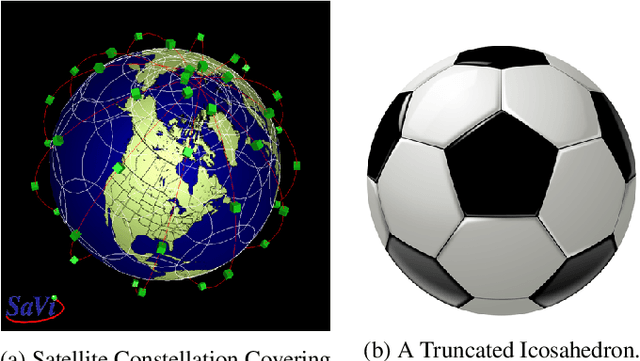
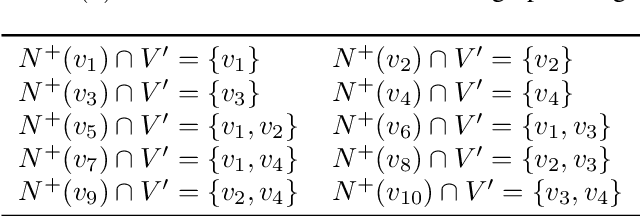
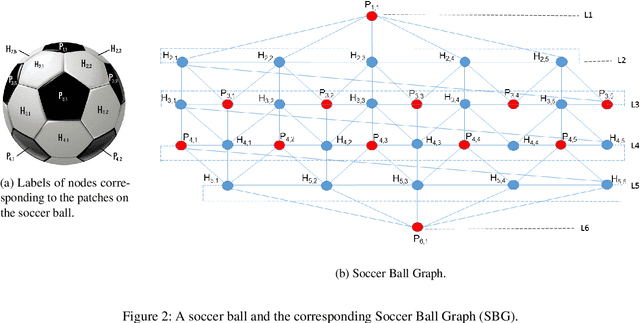
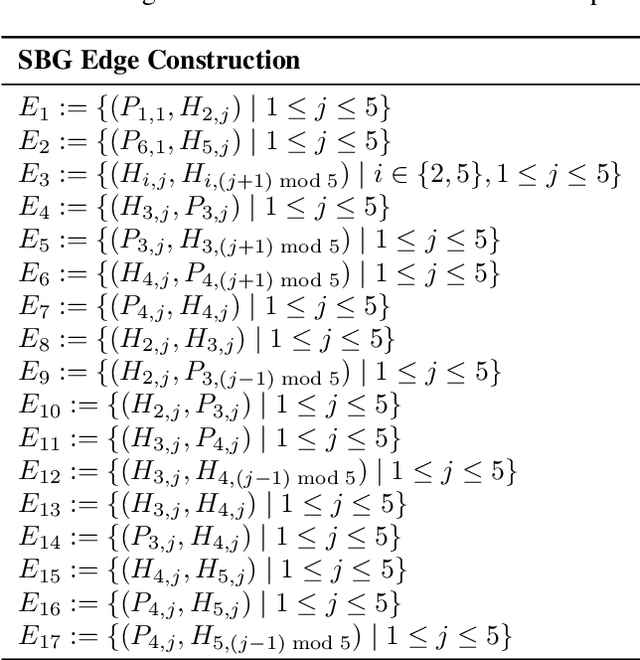
Abstract:In the context of satellite monitoring of the earth, we can assume that the surface of the earth is divided into a set of regions. We assume that the impact of a big social/environmental event spills into neighboring regions. Using Identifying Code Sets (ICSes), we can deploy sensors in such a way that the region in which an event takes place can be uniquely identified, even with fewer sensors than regions. As Earth is almost a sphere, we use a soccer ball as a model. We construct a Soccer Ball Graph (SBG), and provide human-oriented, analytical proofs that 1) the SBG has at least 26 ICSes of cardinality ten, implying that there are at least 26 different ways to deploy ten satellites to monitor the Earth and 2) that the cardinality of the minimum Identifying Code Set (MICS) for the SBG is at least nine. We then provide a machine-oriented formal proof that the cardinality of the MICS for the SBG is in fact ten, meaning that one must deploy at least ten satellites to monitor the Earth in the SBG model. We also provide machine-oriented proof that there are exactly 26 ICSes of cardinality ten for the SBG.
Predicting Future Opioid Incidences Today
Jun 20, 2019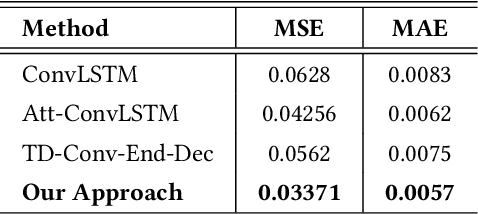


Abstract:According to the Center of Disease Control (CDC), the Opioid epidemic has claimed more than 72,000 lives in the US in 2017 alone. In spite of various efforts at the local, state and federal level, the impact of the epidemic is becoming progressively worse, as evidenced by the fact that the number of Opioid related deaths increased by 12.5\% between 2016 and 2017. Predictive analytics can play an important role in combating the epidemic by providing decision making tools to stakeholders at multiple levels - from health care professionals to policy makers to first responders. Generating Opioid incidence heat maps from past data, aid these stakeholders to visualize the profound impact of the Opioid epidemic. Such post-fact creation of the heat map provides only retrospective information, and as a result, may not be as useful for preventive action in the current or future time-frames. In this paper, we present a novel deep neural architecture, which learns subtle spatio-temporal variations in Opioid incidences data and accurately predicts future heat maps. We evaluated the efficacy of our model on two open source datasets- (i) The Cincinnati Heroin Overdose dataset, and (ii) Connecticut Drug Related Death Dataset.
 Add to Chrome
 Add to Firefox
 Add to Edge